DAX — week of July 27 – 31, 2026: Long
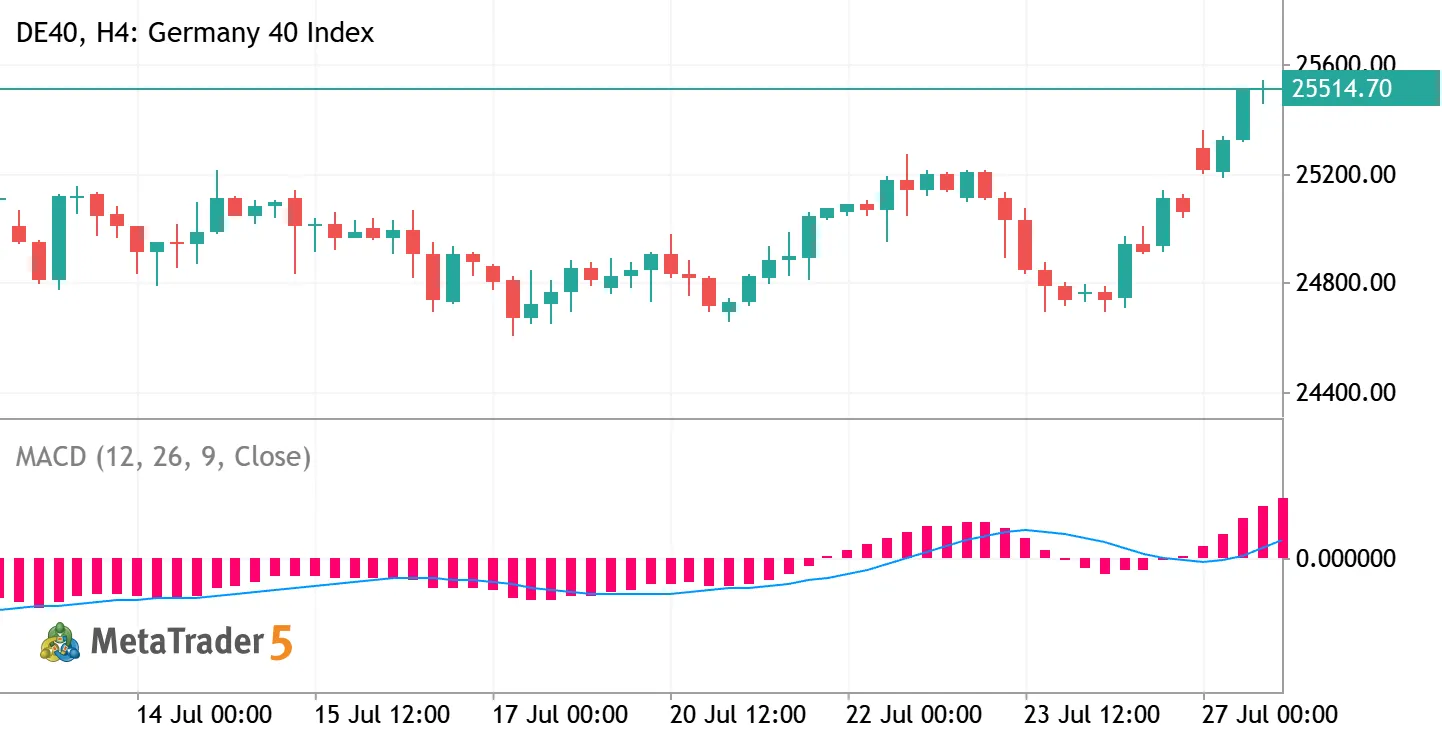
Long — Last week's map wanted 24,715 and the tape refused to pay it — the break off Wednesday's 25,370 died at 24,784, 69 points short, and Friday bought the whole thing back to a green 25,172 close. A market that won't do the easy thing is loading the hard one. This morning it gapped onto 25,370, last week's exact ceiling, held the retest 42 points above Friday's 25,228 high, and folded weekly R1 at 25,436 before lunch. Here is the mechanism behind the speed: resistance is inventory — prices where somebody owns something and defends it — and above 25,370 there is none. July 8 crossed the entire 25,000–25,660 corridor in one 703-point session on 34,226 lots, the heaviest day of the month, and in the thirteen sessions since, nothing above 25,370 has traded at all. That vacuum is why 300
0