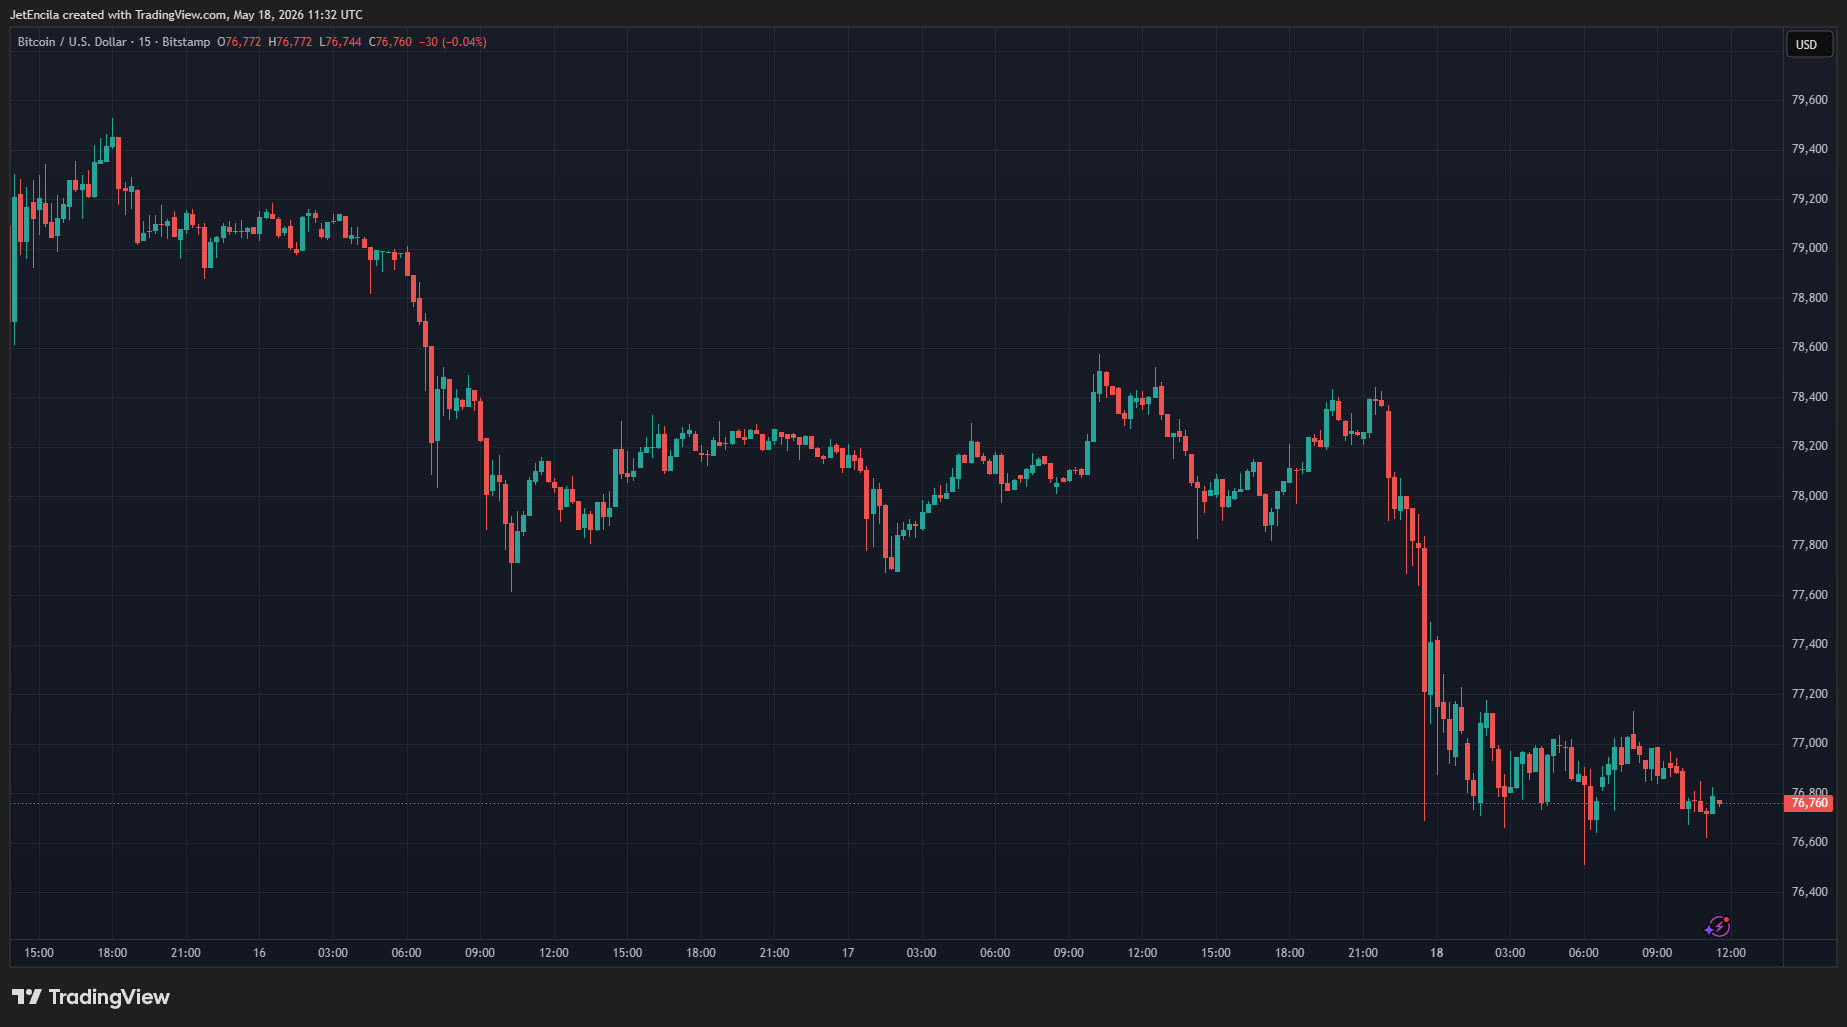
Bitcoin’s bearish momentum hit hardest on the technical charts, with the cryptocurrency breaking below all major exponential moving averages by early Monday.
Trading around $76,750, it sat well beneath the 20-hour EMA at $77,580, the 50-hour at $78,120, the 100-hour at $78,767, and the 200-hour at $79,350.
MACD indicators reinforced the downside pressure, with the line at negative 359, the signal at negative 243, and the histogram at negative 116.
Geopolitical Shock Hits An Already Weakened Market
The slide began Sunday night after US President Donald Trump posted a pointed warning to Iran on Truth Social:
“For Iran, the Clock is Ticking, and they better get moving, FAST, or there won’t be anything left of them. TIME IS OF THE ESSENCE!” Trump wrote , following stalled diplomatic talks and a call with Israeli Prime Minister Benjamin Netanyahu.

The post immediately rattled financial markets. Oil prices climbed. The US dollar strengthened. Investors pulled back from riskier assets — and Bitcoin was among the first to feel it.
By early Monday, Bitcoin was trading at roughly $76,780, down about 1.55% over the prior 24 hours, according to Coingecko data.
The day’s range ran from a low near $76,680 to a high of $78,530. Trading volume surpassed $24 billion. The drop erased approximately $33 billion from Bitcoin’s market capitalization in a matter of hours.
ETF Outflows Had Already Set The Stage
The Iran headlines landed on a market that was already under pressure. US spot Bitcoin ETFs recorded a record single-day net withdrawal of $635 million on May 13 — the largest outflow since late January.
That figure contributed to a total of $1 billion leaving ETF funds over the course of the week, snapping a six-week inflow streak. Additional redemptions followed in subsequent sessions, pointing to fading institutional appetite after a period of strong buying.
Broader conditions made things worse. Sticky inflation figures — both PPI and CPI — weighed on sentiment. Rising Treasury yields added to the pressure. Thin weekend trading liquidity amplified every move.
Bitcoin had pushed toward the $80,000 to $82,000 range earlier in May, buoyed by optimism around the Clarity Act . But repeated failures to break through resistance left the market exposed. Profit-taking set in.
Support And Resistance In FocusTraders are now watching two key zones closely. Resistance sits between $79,000 and $82,000. Downside support is clustered around $74,000 to $76,000.
A relief bounce remains possible if geopolitical tensions ease — oversold conditions could attract buyers. But if the US-Iran standoff deepens or oil prices keep climbing, analysts say the selling pressure is unlikely to let up quickly.
Featured image from Atta Kenare/AFP via Getty Images|Charly Triballeau/AFP via Getty Images, chart from TradingView