Data shows the sentiment in the cryptocurrency sector has plummeted deep into extreme fear as Bitcoin and other assets have crashed.
Bitcoin Fear & Greed Index Has Dropped To A Low Of 11
The “ Fear & Greed Index ” refers to an indicator created by Alternative that tells us about the average sentiment present among traders in the Bitcoin and wider cryptocurrency markets.
The index uses a numerical scale running from zero to hundred for representing the investor mentality. All values on this scale above 53 correspond to a sentiment of greed, while those below 47 to one of fear. The metric being between these two cutoffs naturally suggests a net neutral mentality.
Besides these three main zones, there are two extreme regions called the extreme fear (25 and under) and extreme greed (above 75). Currently, the market is in the former of these two zones.
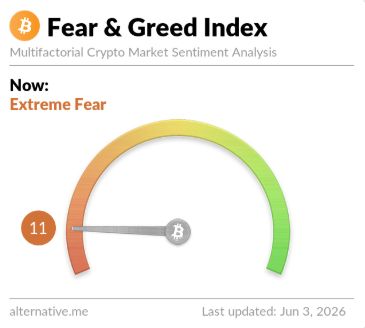
As is visible above, the Bitcoin Fear & Greed Index has a value of 11 right now, which is deep inside extreme fear. Thus, it would appear that investors are quite pessimistic about the market.
Just a couple of days ago, the sentiment was inside the normal fear region. The sharp deterioration since then has come as a result of the steep drawdown that BTC and other assets have faced.
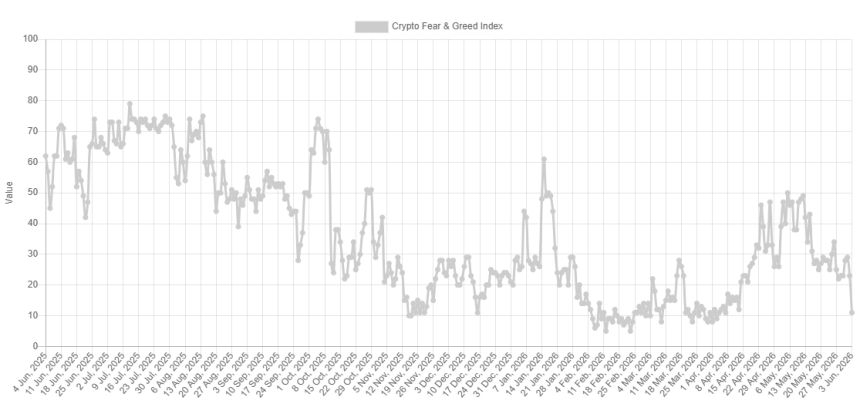
As displayed in the above graph, the latest decline in the Fear & Greed Index has meant that its value is now at its lowest since early April. Historically, digital assets have often tended to go contrary to the opinion of the majority, so this extremely fearful mentality may not actually be a bad sign for the sector.
That said, the current value of 11 alone may not be able to dictate whether a bottom is close. Back in February, the index went to a low of 5 before the market found some stability.
In some other news, the recent Bitcoin plunge has come alongside a contracting demand in the market, as highlighted by CryptoQuant head of research Julio Moreno in an X post .
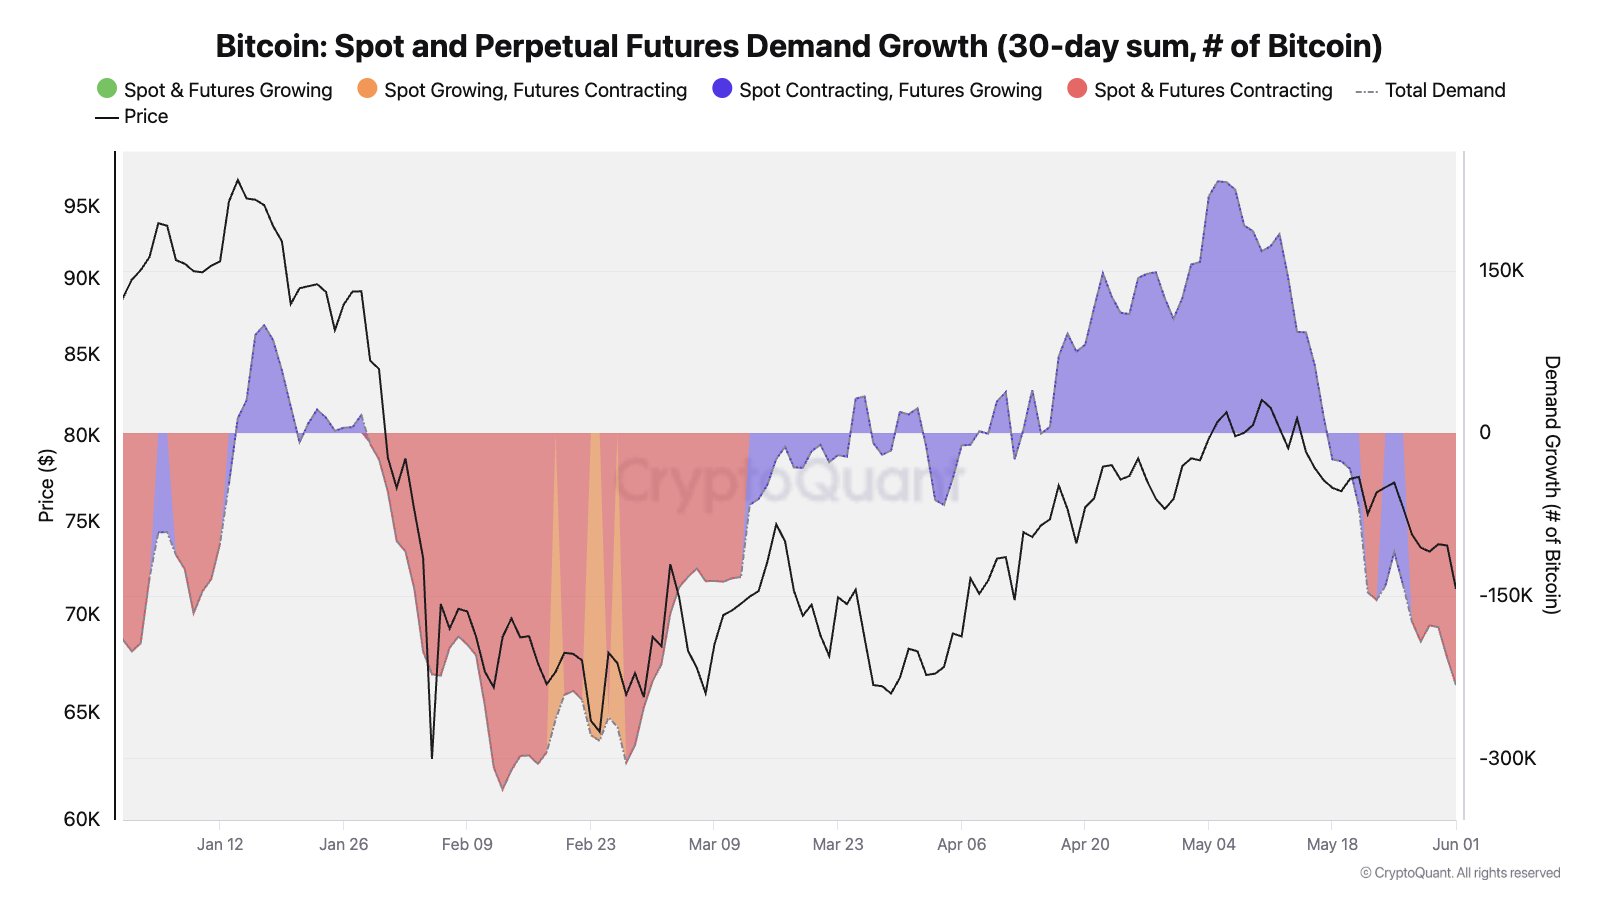
From the chart, it’s apparent that the 30-day change in the combined Bitcoin spot and futures demand has been negative recently. Over the past month, demand has contracted by 232,000 BTC on these markets. Moreno explained:
The ongoing price correction is completely related to Bitcoin demand conditions and has nothing to do with stocks (all-time highs), oil or macro (e.g. manufacturing activity is growing faster).
BTC Price
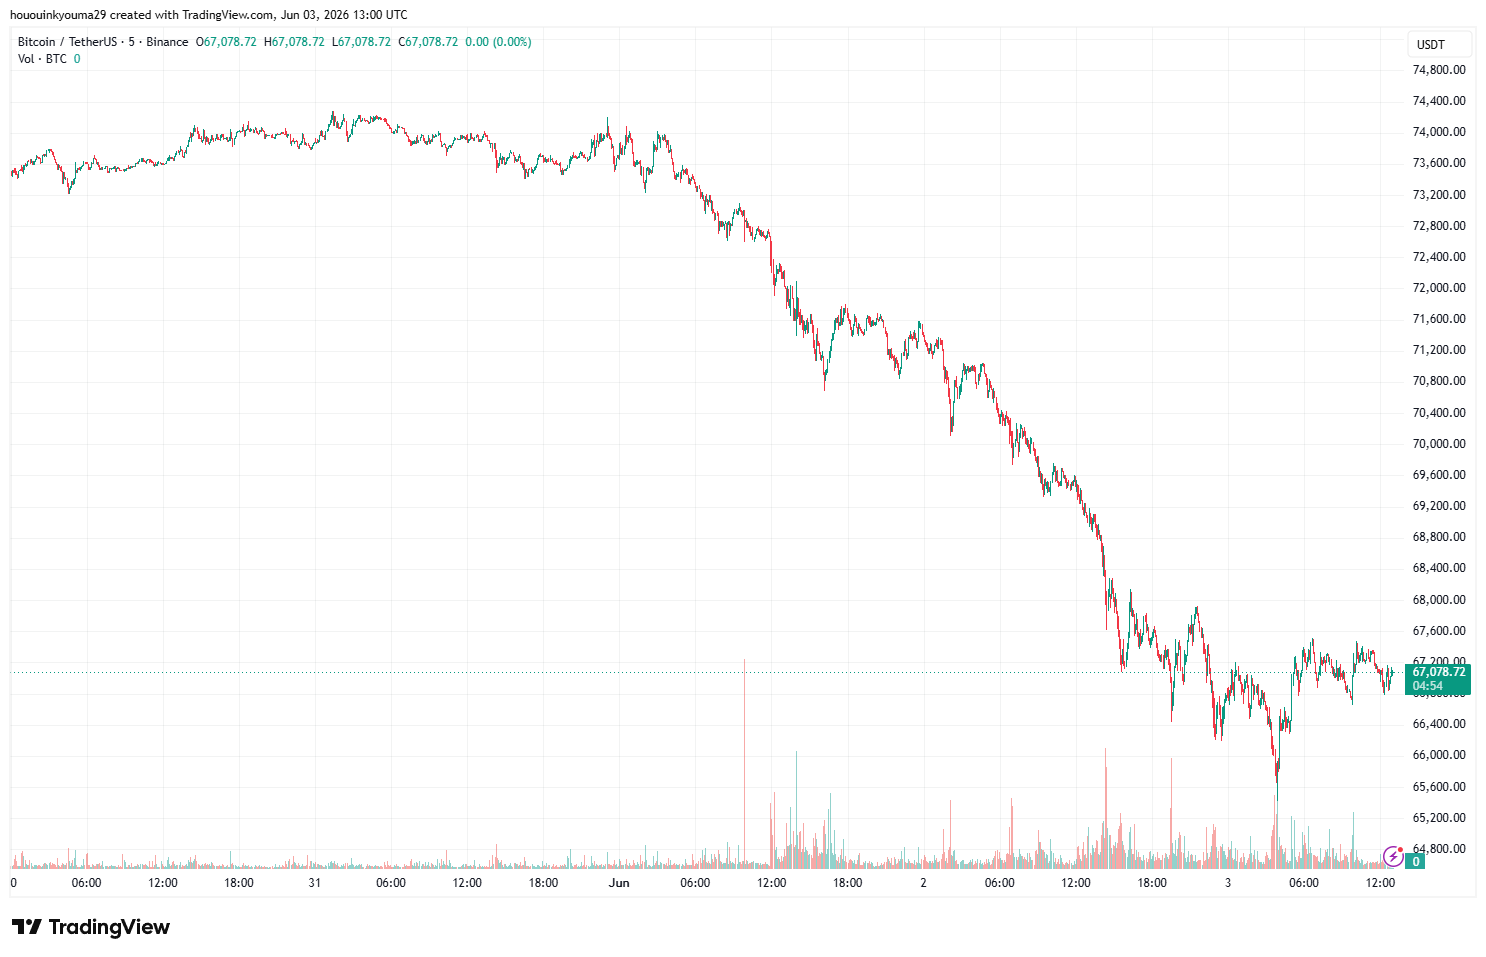
At the time of writing, Bitcoin is trading around $67,000, down more than 11% over the past week.