A cryptocurrency analyst has pointed out how the support level of a 9-year long pattern could provide the “ultimate” buy-the-dip opportunity for XRP.
XRP Has Potentially Been Following A Long-Term Ascending Triangle
In a new post on X, analyst Ali Martinez has shared a long-term pattern in the monthly price chart of XRP. The pattern in question is an “ Ascending Triangle ” from technical analysis (TA) , which forms when an asset trades between two converging trendlines. A key feature of the Ascending Triangle that sets it apart from other triangle patterns is that its upper trendline is parallel to the time-axis.
Like with other consolidation patterns in TA, the upper line of an Ascending Triangle is also considered likely to be a source of resistance, while the lower one that of support. Together, the trendlines keep the asset trapped in the region between them.
In the scenario that one of the levels fails to hold up, a sustained break could happen in that direction. That is, a surge above the resistance level may lead to bullish price action, while a fall under support could signal a bearish continuation.
Now, here is the chart shared by Martinez that shows the Ascending Triangle that the monthly XRP price has been following since 2017:
As displayed in the above graph, XRP retested the resistance level of this long-term Ascending Triangle in August 2025, but the cryptocurrency ended up finding rejection at it. Since then, the coin has gradually been making its way down the channel. “Since 2017, the script has remained the same: XRP hits the upper resistance (X-axis), gets rejected, and retraces to find its floor at the rising trendline,” noted the analyst.
In the scenario that this past pattern repeats, it’s possible that XRP could end up revisiting the support level between $0.75 and $0.80. “In my view, this zone represents the ultimate “buy the dip” opportunity before the triangle finally reaches its apex,” explained Martinez. Generally, the closer the price gets to the pattern’s apex, the more probable a breakout could be assumed.
As such, the coming years could see the cryptocurrency finally escape from this pattern. “When a 9-year consolidation finally breaks, the move is usually historic,” said the analyst. As for which direction a break might occur, Ascending Triangles are usually considered to be bullish continuation patterns. Therefore, a surge above the triangle may be more likely to occur.
“The next $XRP bull market will be huge!” noted Martinez, based on this pattern. It now remains to be seen whether the Ascending Triangle will hold and which way an escape will happen in.
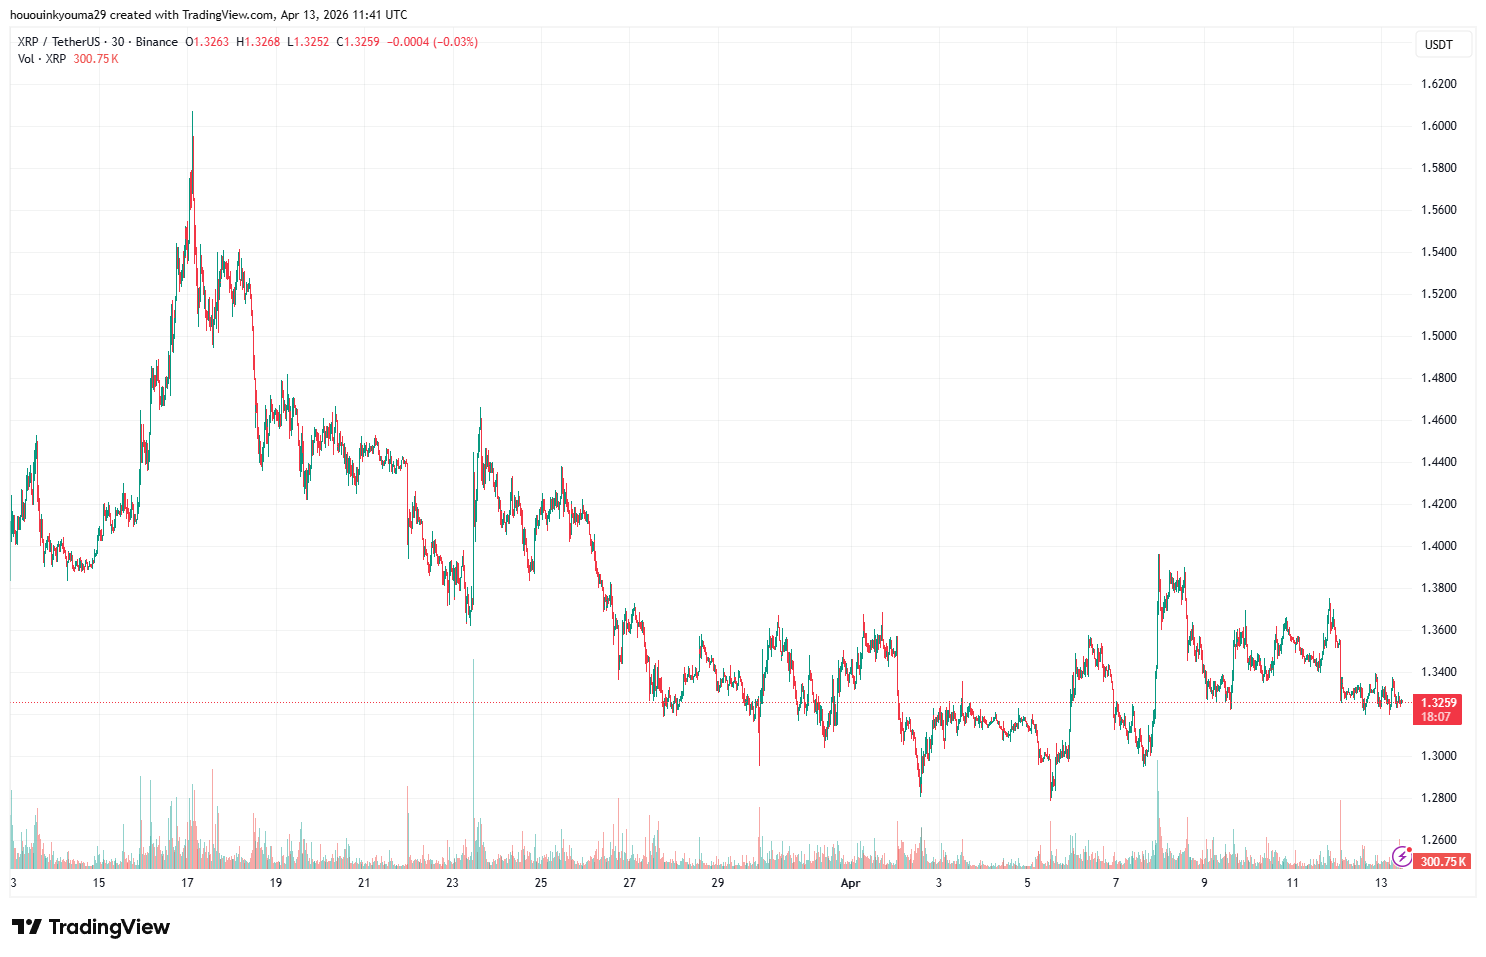
XRP Price
At the time of writing, XRP is trading around $1.32, down 2% over the last week.