

NVDA
#1
NVIDIA Corporation - Common Stock
210.9 6 USD
-0.01%
Market Price
Settore: Tecnologia
Base: USD
Valuta di Profitto: USD
Intervallo Giornaliero
Intervallo Annuale
Variazione giornaliera
-0.59%
Variazione Mensile
-6.30%
Variazione di 6 mesi
+0.62%
Variazione Annuale
+11.04%
Chiusura Precedente
212.2 1
Open
210.9 4
Minimo
210.1 8
Massimo
213.8 5
Financials
Valore 202020212022202320242025
Notizie
OpenAI impone l’addestramento offline per i modelli AI avanzati
Il boom dell’IA non è il 1999 — e i colossi tech potrebbero attutire un crollo del mercato, dice questo CEO
La crescita di Nvidia potrebbe rallentare al 20%, ma il suo titolo può ancora raddoppiare, dice un esperto
S&P 500 vicino ai massimi storici, ma il 60% dei titoli è in un mercato ribassista. SPY sta nascondendo un problema più grande?
Le azioni Stellantis scendono a un nuovo minimo di 52 settimane: cosa sta succedendo?
ESCLUSIVO: la svendita dei chip in Corea segnala un raro segnale di “capitolazione” in vista dei risultati di SK Hynix, afferma l’analista
Borse oggi | Wall Street | Dow giù con le tlc dopo la mossa di SpaceX
Apple può superare Nvidia? Il duo iPhone e gli utili del 2 novembre tengono la chiave
Newegg inizia a ricevere ordini per i laptop NVIDIA RTX Spark
Newegg annuncia la disponibilità dei laptop Nvidia RTX Spark negli Stati Uniti e in Canada
Fuga dall’IA, BofA punta le small cap: 7 su 10 titoli scelti in forte RIALZO
Grafici & Idee
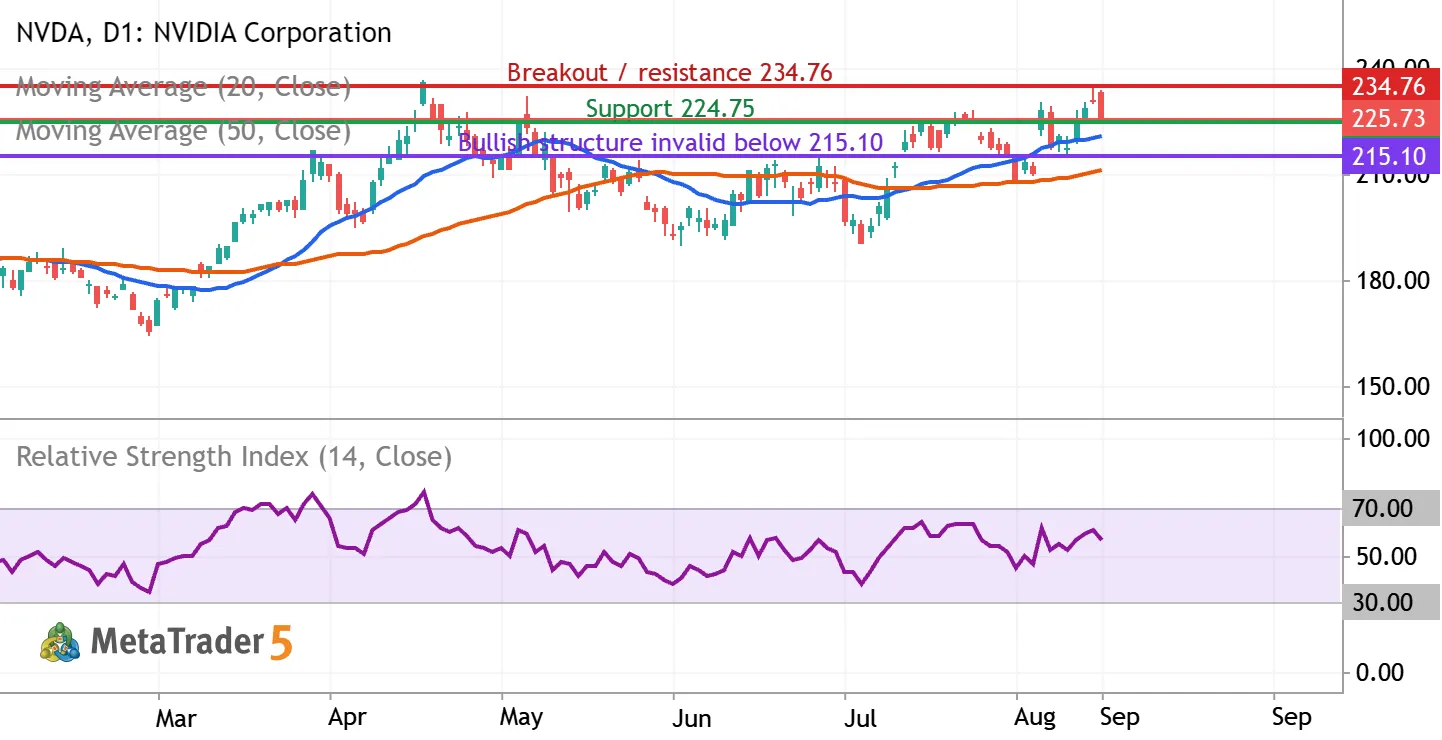
NVDA: testing $225 support as the uptrend meets $234.76 resistance
NVIDIA (NASDAQ: NVDA) | Daily chart | September 9, 2026 Bias: conditionally bullish over the next 2–6 weeks. Entry confirmation is still required. The latest completed regular session, September 8, closed at $225.73, down 2.01%, after reaching $233.71 intraday. The close near the session low signals selling pressure despite the broader recovery. What the indicators show The chart includes a blue 20-day simple moving average, an orange 50-day simple moving average, and purple RSI(14), all calculated from closing prices. At the latest completed candle, MetaTrader showed the averages near $220.48 and $211.22, with RSI near 56.19. Price remains above both rising averages, and the 20-day average is above the 50-day average. RSI above 50 supports positive momentum, but its reading below 70 is


The NVDA doesn’t have other trading ideas at this time
Browse ready-made trading ideas or select a symbol and create your own
Go to Charts and Trading Ideas