Anteprima

#Ultimi 7 Giorni
1
AAPL
Apple Inc. - Common Stock
342.37 USD-0.52%-0.09%+3.19%+27.30%4.98 T USD
2
NVDA
NVIDIA Corporation - Common Stock
186.64 USD+2.78%-10.09%-20.20%-4.34%4.50 T USD
3
MSFT
Microsoft Corporation - Common Stock
530.61 USD-0.99%+1.24%+0.45%+6.15%3.94 T USD
4
GOOGL
Alphabet Inc. - Class A Common Stock
284.78 USD+0.78%+0.82%-18.97%+0.13%3.50 T USD
5
AMZN
Amazon.com, Inc. - Common Stock
259.30 USD-0.35%+6.67%+1.17%+4.43%2.80 T USD
6
TSM
Taiwan Semiconductor Manufacturing Company Ltd
375.22 USD+6.59%-9.09%-19.21%+27.47%1.95 T USD
7
SPCX
SpaceX Space Exploration Technologies Corp
134.27 USD+8.62%-2.02%-18.79%-10.49%1.82 T USD
8
META
Meta Platforms, Inc. - Class A Common Stock
610.15 USD+0.84%-0.70%-16.01%-3.36%1.56 T USD
9
TSLA
Tesla, Inc. - Common Stock
358.22 USD+4.23%-11.49%-6.32%-18.52%1.42 T USD
10
AVGO
Broadcom Inc. - Common Stock
293.69 USD+0.74%-10.58%-19.67%-18.03%1.40 T USD

Mappa di Calore

Grafici & Idee

#XAUUSD: A Bear Trap at $4,000? XAUUSD Gold vs US Dollar

#XAUUSD: A Bear Trap at $4,000?

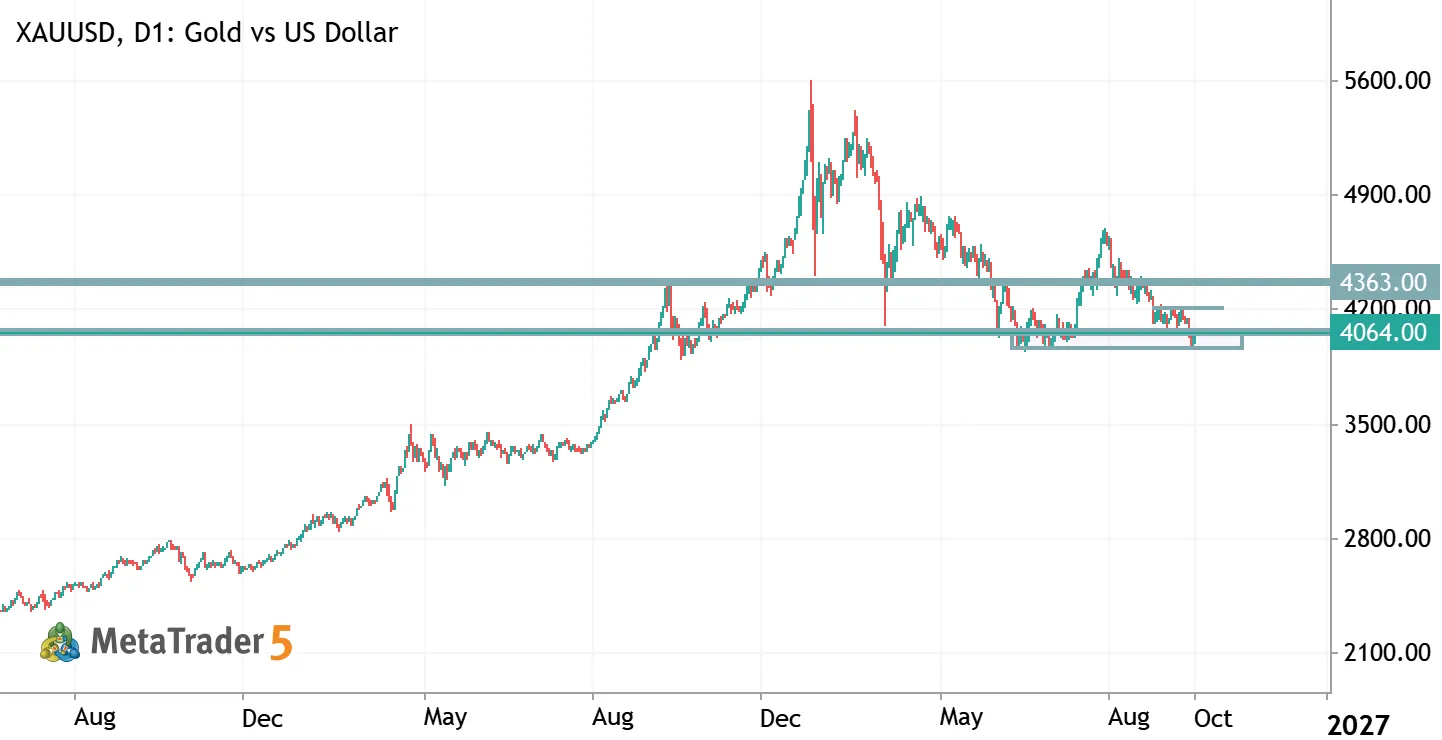
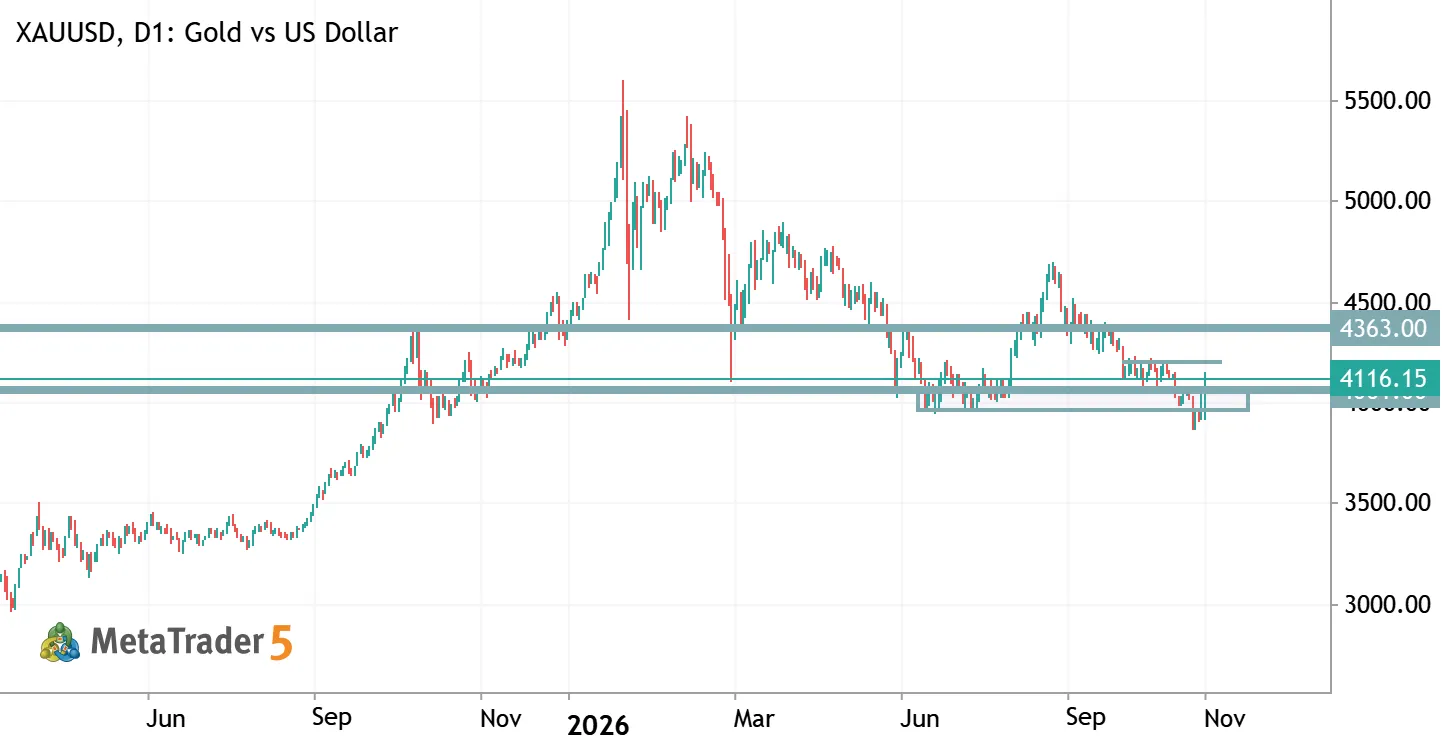
Gold has staged a sharp reversal after falling below the psychologically important $4,000 level . Fundamental support came from the U.S. midterm election results, where Democrats strengthened their political position. A weaker U.S. dollar, declining Treasury yields, and easing inflation concerns amid falling oil prices created favorable conditions for a recovery in XAUUSD. Technically, the situation resembles a classic bear trap. Following the breakdown below support, sellers failed to extend the decline. The price quickly recovered above $4,000, potentially triggering short covering and adding momentum to the rally. Key Levels: $4,150–4,180 — the highest-volume trading area over the past year and immediate resistance. $4,000–4,040 — an important support zone. $3,900 — the area of recent

USDJPY Approaches 160: Carry Trade Strength vs Japan Intervention Risk USDJPY US Dollar vs Yen

USDJPY Approaches 160: Carry Trade Strength vs Japan Intervention Risk

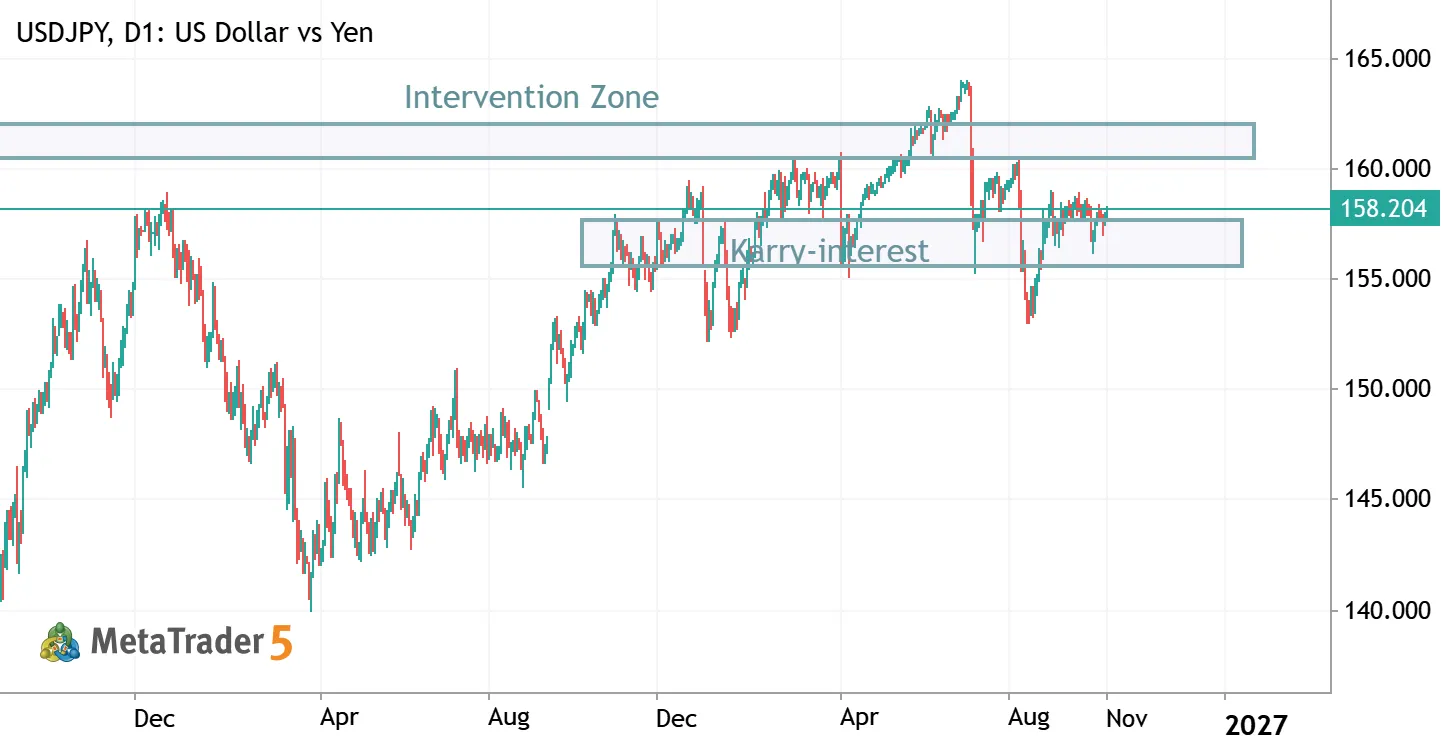
USDJPY is once again approaching the psychologically important 160 level , where market attention traditionally shifts toward possible action by Japanese financial authorities. However, reaching 160 does not automatically mean that a currency intervention will follow. For Japan’s Ministry of Finance and the Bank of Japan, other factors also matter, including the speed of yen depreciation, the nature of the USDJPY move, and the level of speculative activity . A gradual rise and a sharp speculative spike are very different situations from the perspective of potential policy action. Why Does USDJPY Remain Strong? The main fundamental driver remains the interest rate differential between the United States and Japan. After the latest Federal Reserve meeting, the U.S. policy rate remained in the
USTEC (NQ) 24H Outlook: Liquidity Sweep & SIBI Rebalance Toward 28,089 TEC USTEC Short US Tech 100 Index

USTEC (NQ) 24H Outlook: Liquidity Sweep & SIBI Rebalance Toward 28,089

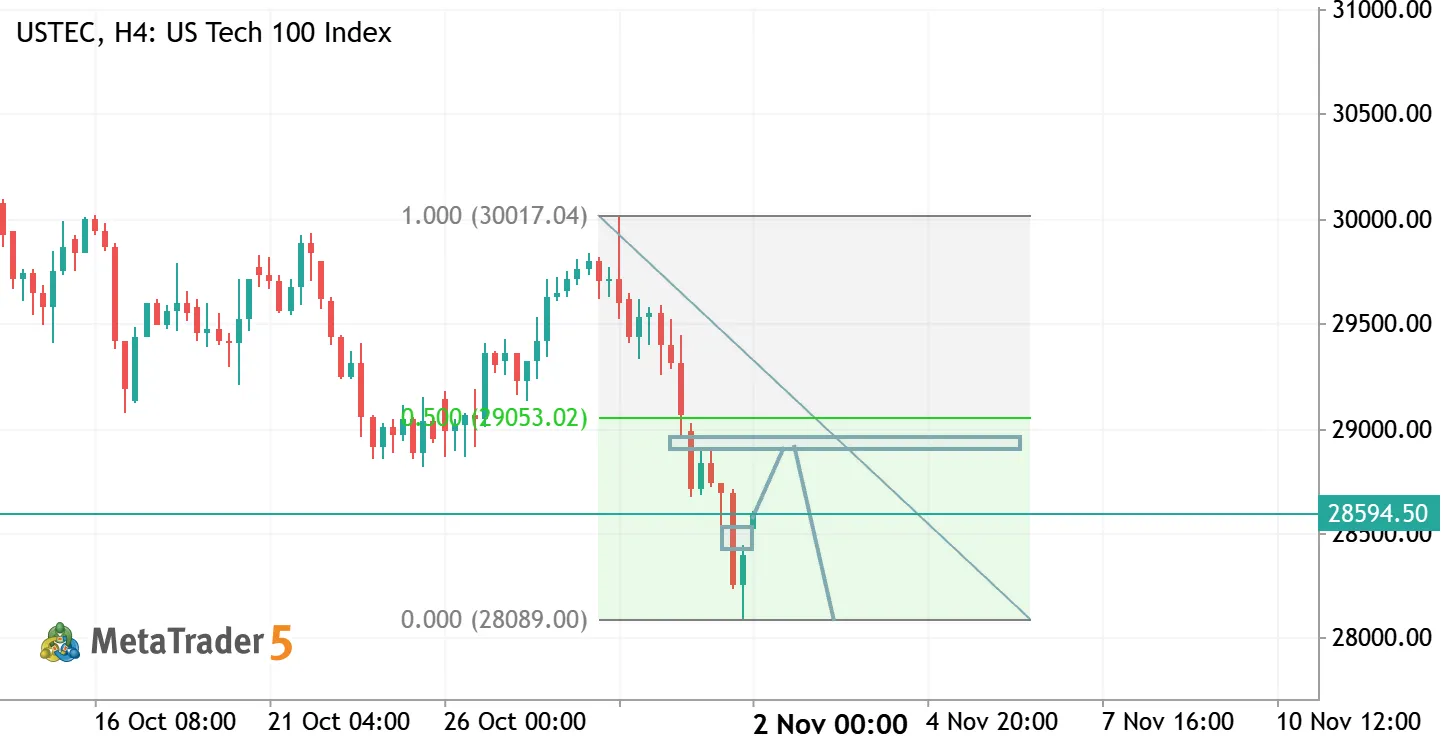
Market Structure & ICT Context (H4) USTEC (US Tech 100) remains firmly in a Bearish Market Structure on the H4 timeframe following the aggressive displacement leg down from the 30,021.80 swing high to the 28,089.00 swing low. While the breakdown purged major Sell-Side Liquidity (SSL) below the previous structural floor, the vertical drop left behind significant price inefficiency (Fair Value Gaps / SIBI). Rather than chasing shorts in deep discount around 28,594 , institutional order flow typically seeks to rebalance inefficiency toward Equilibrium before initiating the next expansion leg down. Key Dealing Range & PD Arrays Current Dealing Range: 30,021.80 (High) to 28,089.00 (Low) 50% Equilibrium (Consequent Encroachment): 29,055.00 Immediate Intraday Test: 28,595.00 – 28,680.00
Gold Price Forecast 2026: Will XAUUSD Hold Above $4,000 or Fall to $3,500? XAUUSD Gold vs US Dollar

Gold Price Forecast 2026: Will XAUUSD Hold Above $4,000 or Fall to $3,500?

Gold is once again approaching a critical technical level. Following a substantial correction, XAUUSD is testing the psychological $4,000 mark, which coincides with the highest-volume price area of the past year. Can gold resume its bullish trend? How do high Federal Reserve interest rates, inflation, and rising oil prices affect the precious metal? Let's examine the technical outlook and three probability-based scenarios for the next 3–6 months. XAUUSD Technical Analysis: Why Is $4,000 So Important? The daily gold chart shows a sequence of lower highs, indicating weakening buying pressure. Bulls have yet to restore the previous upward momentum. The key battle is now taking place around $4,000 — both a major psychological level and the highest-volume area over the past year. Holding this
XAUUSD (Gold vs US Dollar), M15 (15-Minute) XAUUSD Long Gold vs US Dollar

XAUUSD (Gold vs US Dollar), M15 (15-Minute)

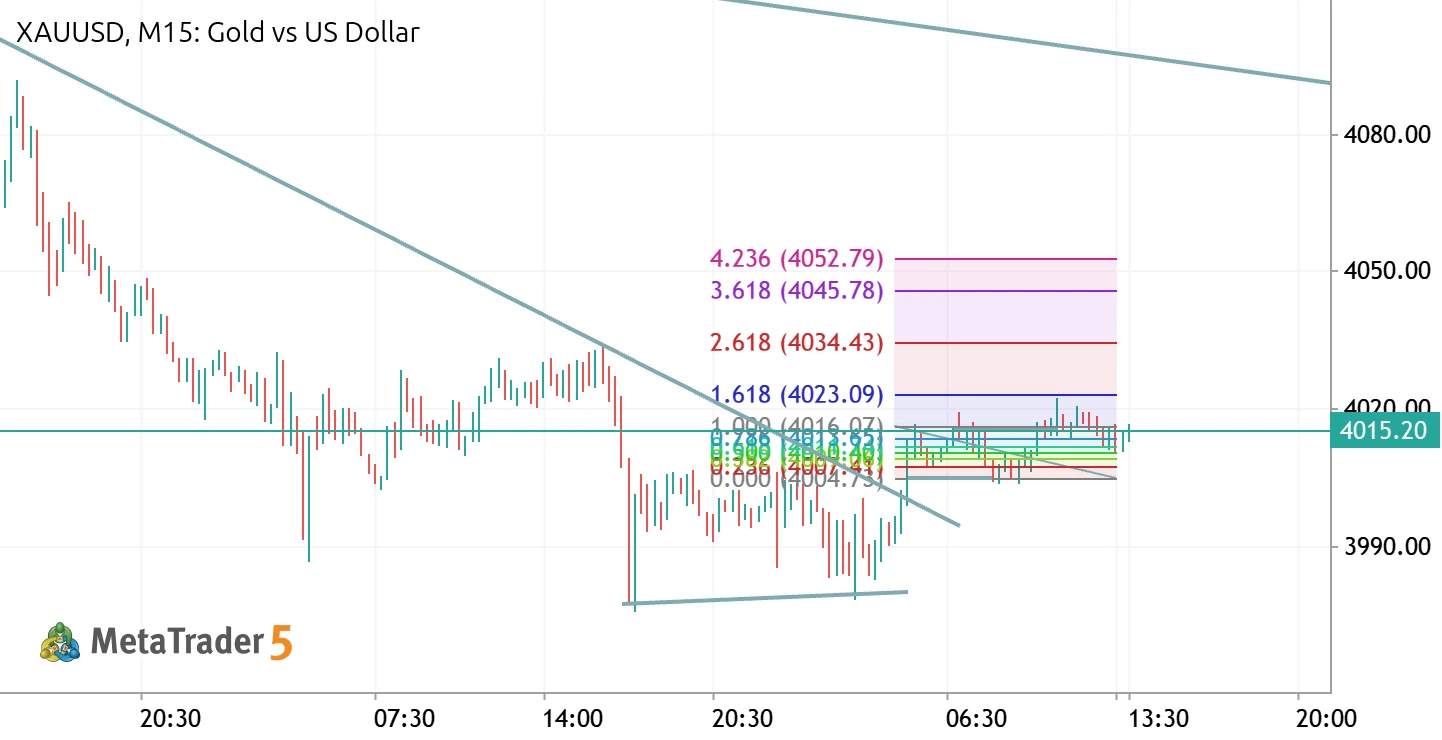
Price Structure & Trend Analysis: Major Trend: Overall, the price movement is still within a downtrend, indicated by the primary descending trendline (the upper diagonal line) acting as dynamic resistance. Short-Term Momentum: At the lower area, the price formed a consolidation pattern and has just broken out of the minor descending trendline. This breakout provides an early signal of a potential upward correction or short-term reversal. Key Levels & Fibonacci Areas: Critical Resistance Area: Currently, the price (at 4015.13) is testing a highly crucial resistance area. This zone is a confluence between the horizontal support/resistance line and the 1.000 Fibonacci level at 4015.67. Upside Projection Targets: Based on the Fibonacci drawing on the chart, if the price successfully
Gold Daily Plan | Oct 21, 2026 XAUUSD Gold vs US Dollar

Gold Daily Plan | Oct 21, 2026

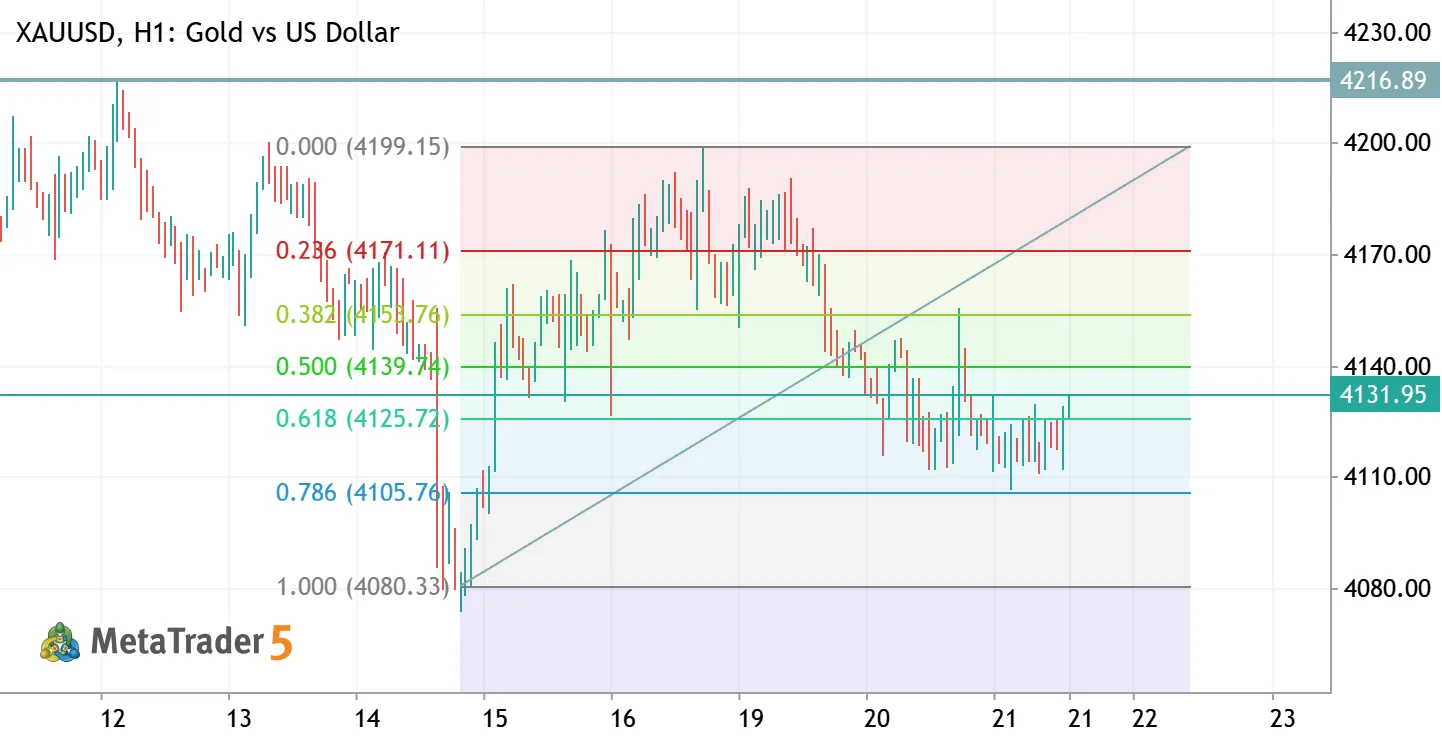
Gold Daily Plan | Oct 21, 2026 – Base at 4105–4113, reclaiming the 0.618 H1 view: Since the 4199 high, gold has been printing lower highs and broke its rising trendline on Oct 19. But sellers keep failing at the **4105–4113 support**, which has held for two days and is building a base. Price is now pushing back above the **0.618 Fibonacci (4125.79)**. Fibonacci of the last bullish leg (4080.41 → 4199.21): - 0.382 → 4153.83 - 0.500 → 4139.81 - 0.618 → 4125.79 - 0.786 → 4105.84 Fundamentals: - Talks over the Strait of Hormuz pulled Brent back from above $110, which eases inflation fears a little. - The headwind: US 10-year yields are above 5.1%, and markets are pricing a Fed hike in December. That keeps rallies limited. - The Fed decision is next week. Today: US crude inventories and the
XAUUSD – Gold Price Outlook | Potential Bearish Continuation XAUUSD Short Gold vs US Dollar

XAUUSD – Gold Price Outlook | Potential Bearish Continuation

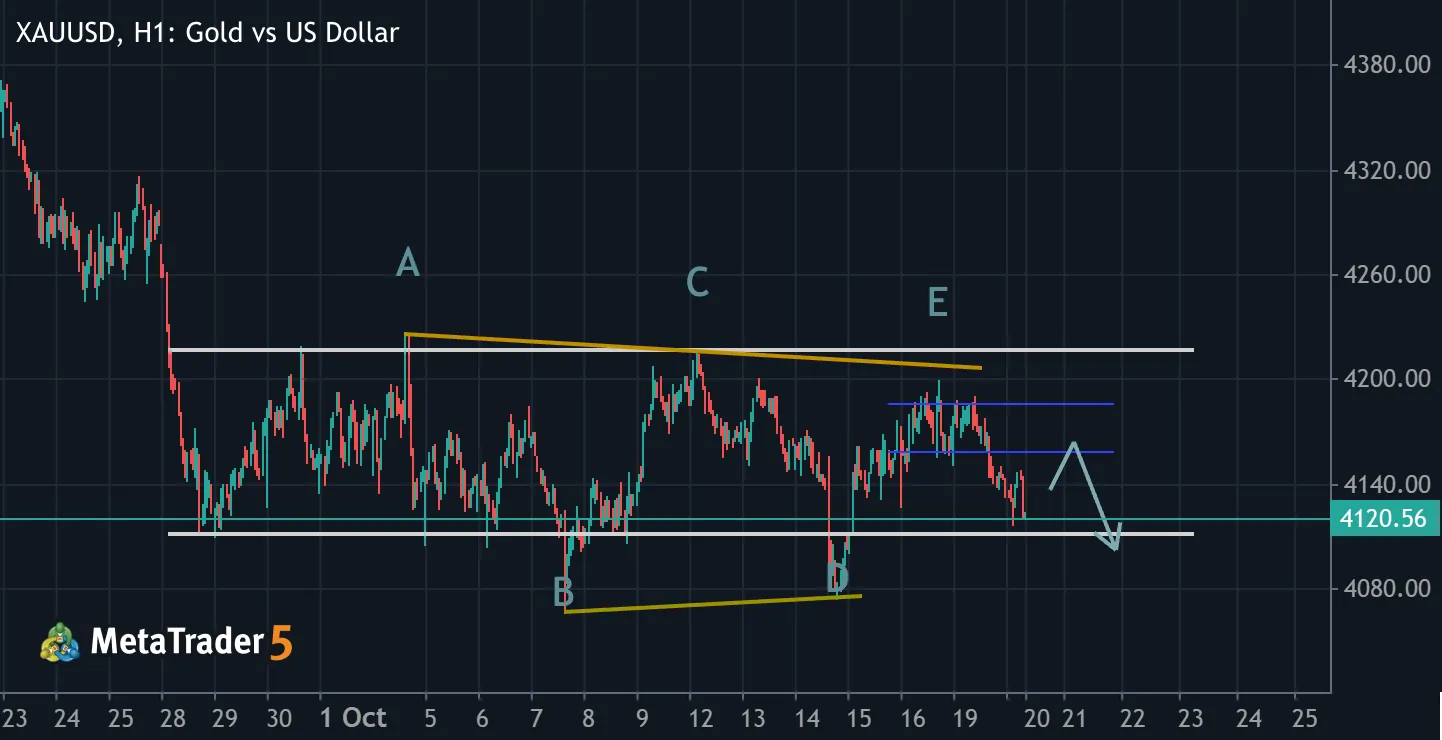
Price action may have completed a triangle wave formation within a larger bearish market structure. A smaller-scale distribution phase around the 4200 level appears to have been completed. Price may revisit the 4160 level to form a Backup (BU) event , potentially setting the stage for a larger bearish move. Disclaimer: This analysis reflects my personal market perspective and is provided for informational purposes only. It does not constitute financial or investment advice.