Screener

#Last 7 Days
1
NVDA
NVIDIA Corporation - Common Stock
212.17 USD+0.57%-5.82%-6.13%+22.94%5.11 T USD
2
AAPL
Apple Inc. - Common Stock
331.34 USD-0.52%+4.61%+8.21%+38.65%4.84 T USD
3
GOOGL
Alphabet Inc. - Class A Common Stock
344.98 USD-1.26%+4.01%-0.37%+37.32%4.22 T USD
4
MSFT
Microsoft Corporation - Common Stock
497.12 USD-1.64%+0.82%+1.41%-2.65%3.69 T USD
5
AMZN
Amazon.com, Inc. - Common Stock
248.42 USD-2.02%-1.46%-6.41%+6.27%2.68 T USD
6
TSM
Taiwan Semiconductor Manufacturing Company Ltd
413.89 USD-1.09%-4.79%-3.79%+56.43%2.15 T USD
7
SPCX
SpaceX Space Exploration Technologies Corp
143.49 USD-3.15%-5.59%+2.51%-4.34%1.89 T USD
8
META
Meta Platforms, Inc. - Class A Common Stock
670.24 USD+0.70%+3.33%+13.65%-14.07%1.71 T USD
9
AVGO
Broadcom Inc. - Common Stock
339.27 USD-1.58%-7.42%-14.56%-5.49%1.62 T USD
10
TSLA
Tesla, Inc. - Common Stock
356.58 USD-0.67%-3.20%+4.66%-14.20%1.41 T USD

Heatmap

Charts & Ideas

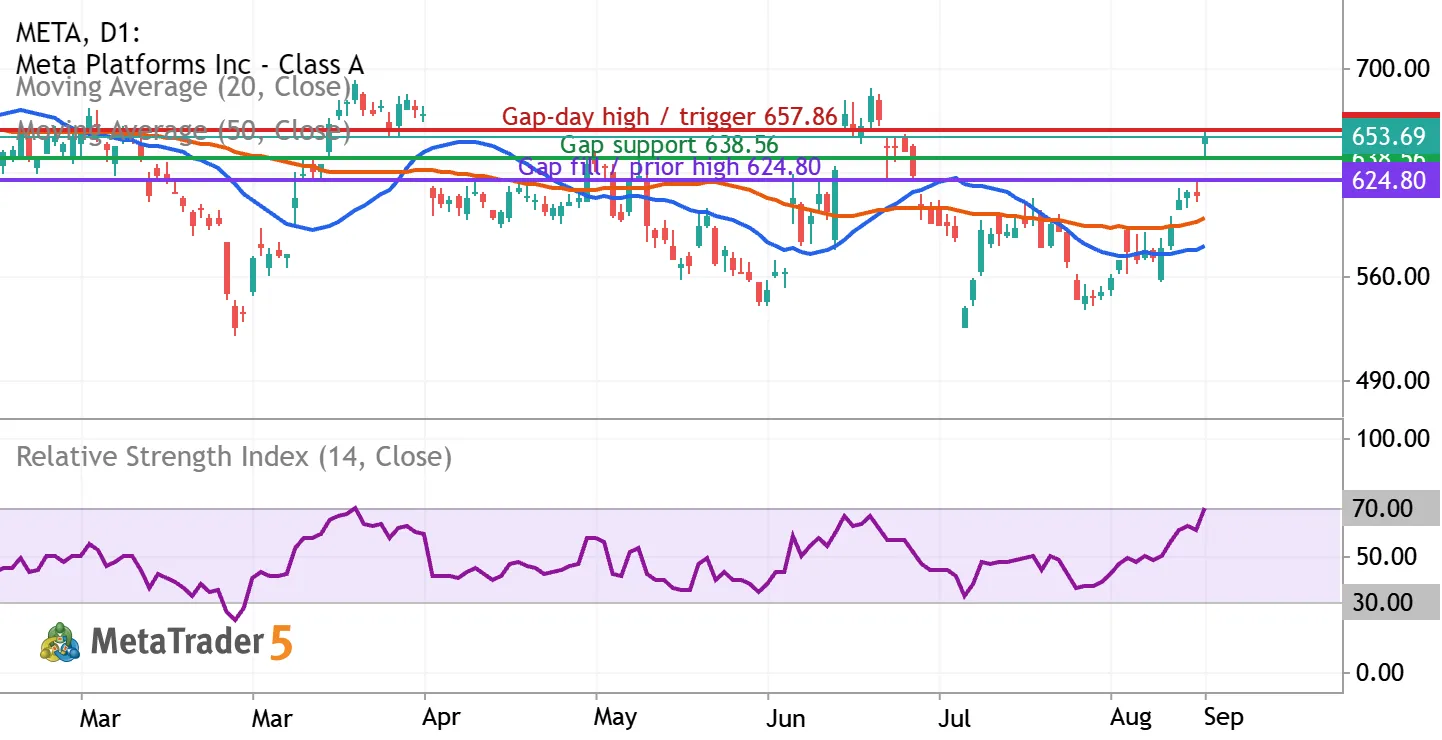
META: gap-up rally puts $638.56 support in focus META Long Meta Platforms, Inc. - Class A Common Stock

META: gap-up rally puts $638.56 support in focus

Meta Platforms (NASDAQ: META) | Daily chart | September 10, 2026 View: conditionally bullish, with patience after a sharp gap higher. Horizon: 2–4 weeks. META closed September 9 at $653.69, up 6.55%. The session low of $638.56 stayed above September 8’s $624.80 high, leaving an unfilled daily gap. Holding that gap would support continuation; a failure would weaken the breakout. Reading the indicators The blue line is the 20-day simple moving average, the orange line the 50-day simple moving average, and the lower panel is RSI(14), all using closing prices. At the September 9 candle, MetaTrader showed approximately $580.54, $598.58, and 70.43 respectively. Price is above both averages, but the 20-day average remains below the 50-day: this is a strong recovery without a fully bullish
NVDA: testing $225 support as the uptrend meets $234.76 resistance NVDA Long NVIDIA Corporation - Common Stock

NVDA: testing $225 support as the uptrend meets $234.76 resistance

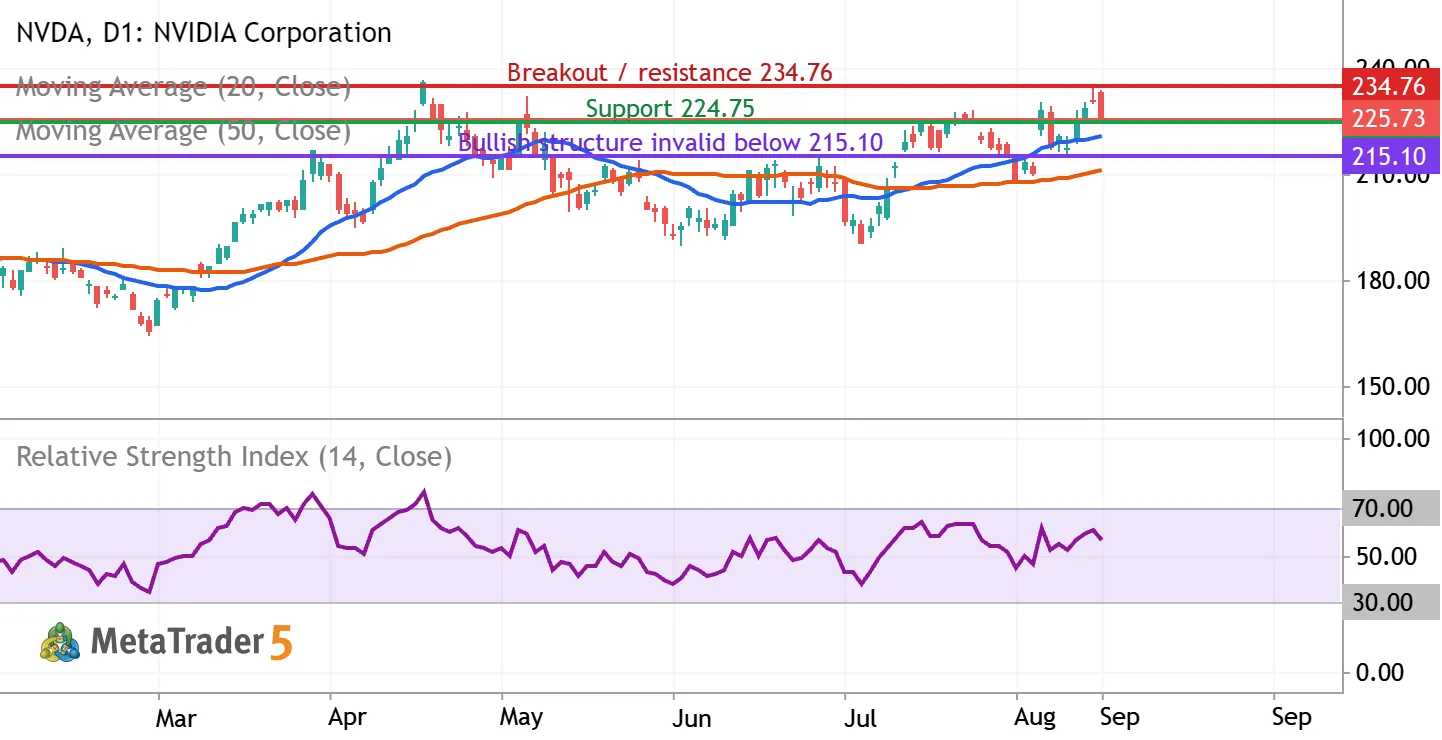
NVIDIA (NASDAQ: NVDA) | Daily chart | September 9, 2026 Bias: conditionally bullish over the next 2–6 weeks. Entry confirmation is still required. The latest completed regular session, September 8, closed at $225.73, down 2.01%, after reaching $233.71 intraday. The close near the session low signals selling pressure despite the broader recovery. What the indicators show The chart includes a blue 20-day simple moving average, an orange 50-day simple moving average, and purple RSI(14), all calculated from closing prices. At the latest completed candle, MetaTrader showed the averages near $220.48 and $211.22, with RSI near 56.19. Price remains above both rising averages, and the 20-day average is above the 50-day average. RSI above 50 supports positive momentum, but its reading below 70 is
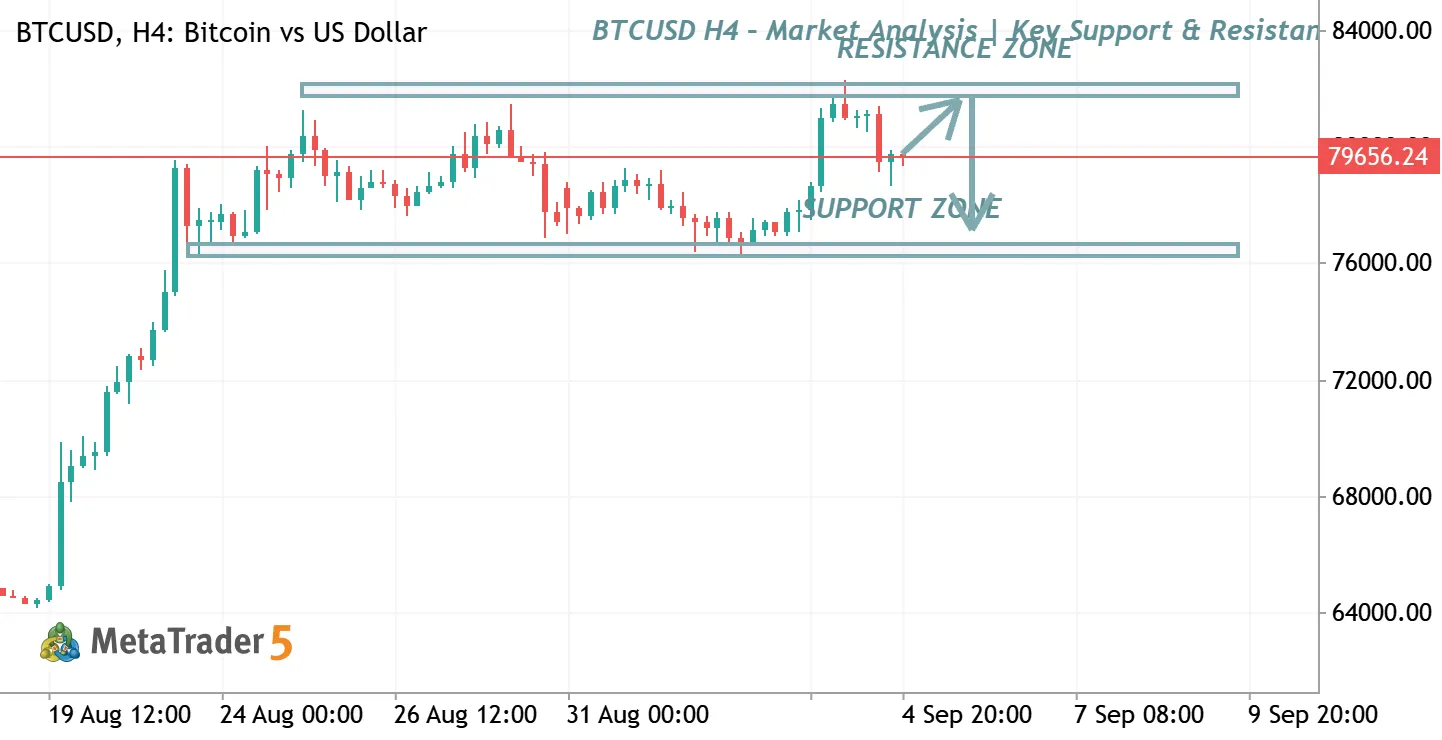
BTCUSD H4 – Market Analysis | Key Support & Resistance BTCUSD Short Bitcoin vs US Dollar

BTCUSD H4 – Market Analysis | Key Support & Resistance

BTCUSD is currently trading between important support and resistance zones on the H4 timeframe. Price is approaching a critical area where traders should watch for confirmation of either a bullish breakout toward the resistance zone or a bearish rejection toward support . 📈 Bullish Scenario: Break and hold above resistance may open the way for further upside. 📉 Bearish Scenario: Rejection from resistance could lead price back toward the major support zone. ⚠️ Trade with proper risk management and wait for confirmation before entering
ETHUSD M30 – Bullish Reversal Opportunity from Support ETHUSD Ethereum vs US Dollar

ETHUSD M30 – Bullish Reversal Opportunity from Support

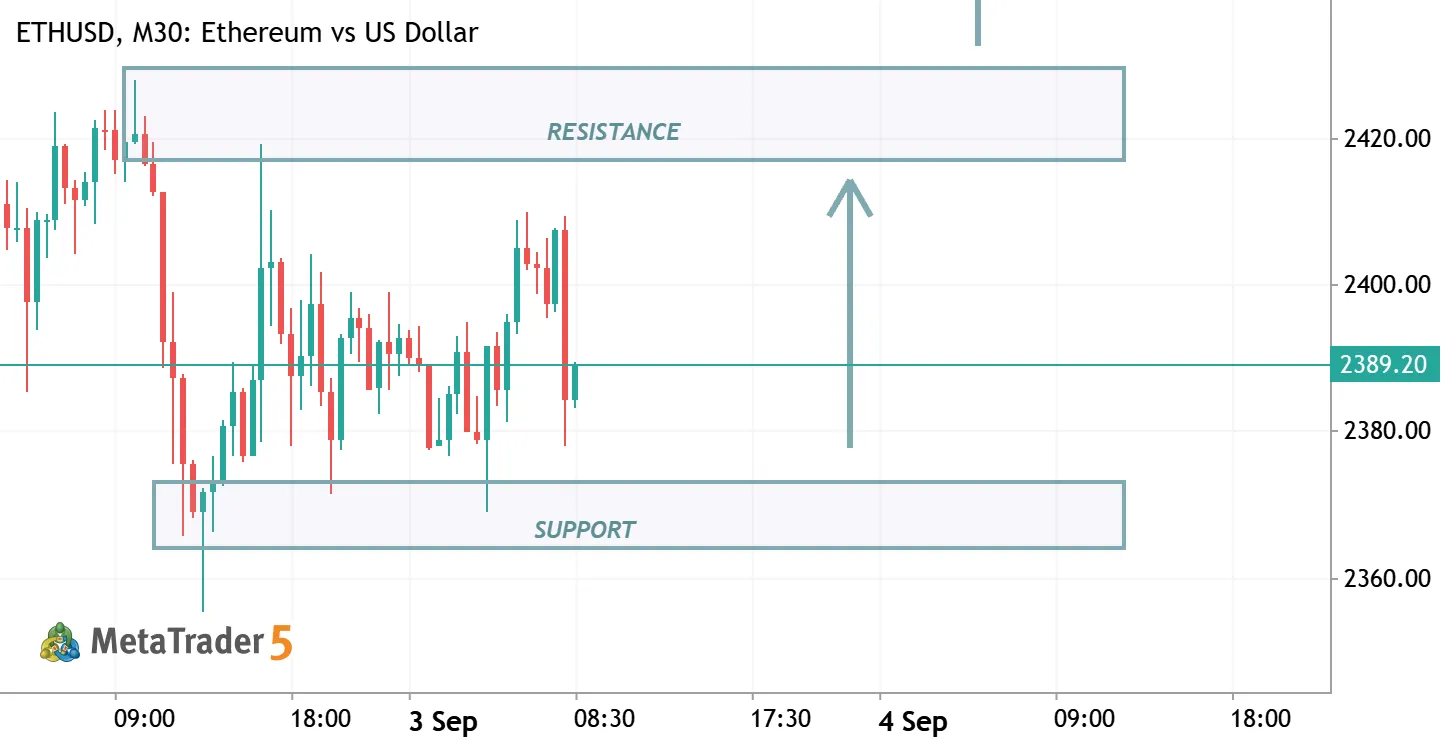
ETHUSD is currently reacting from a key support zone around the 2365 area. The chart indicates potential bullish momentum, with price expected to move toward the nearest resistance zone around 2420–2430 . A successful breakout above this resistance could open the way for a further bullish move toward the major resistance zone near 2480 . 📈🚀 🔹 Instrument: ETHUSD 🔹 Timeframe: M30 🔹 Market Bias: Bullish 🔹 Key Support: 2365 area 🔹 First Target: 2420–2430 🔹 Major Target: 2480 area ⚠️ Always wait for proper market confirmation and apply effective risk management.