AMZN Builds Momentum Near Resistance Zone AMZN Short Amazon.com, Inc. - Common Stock

AMZN Builds Momentum Near Resistance Zone

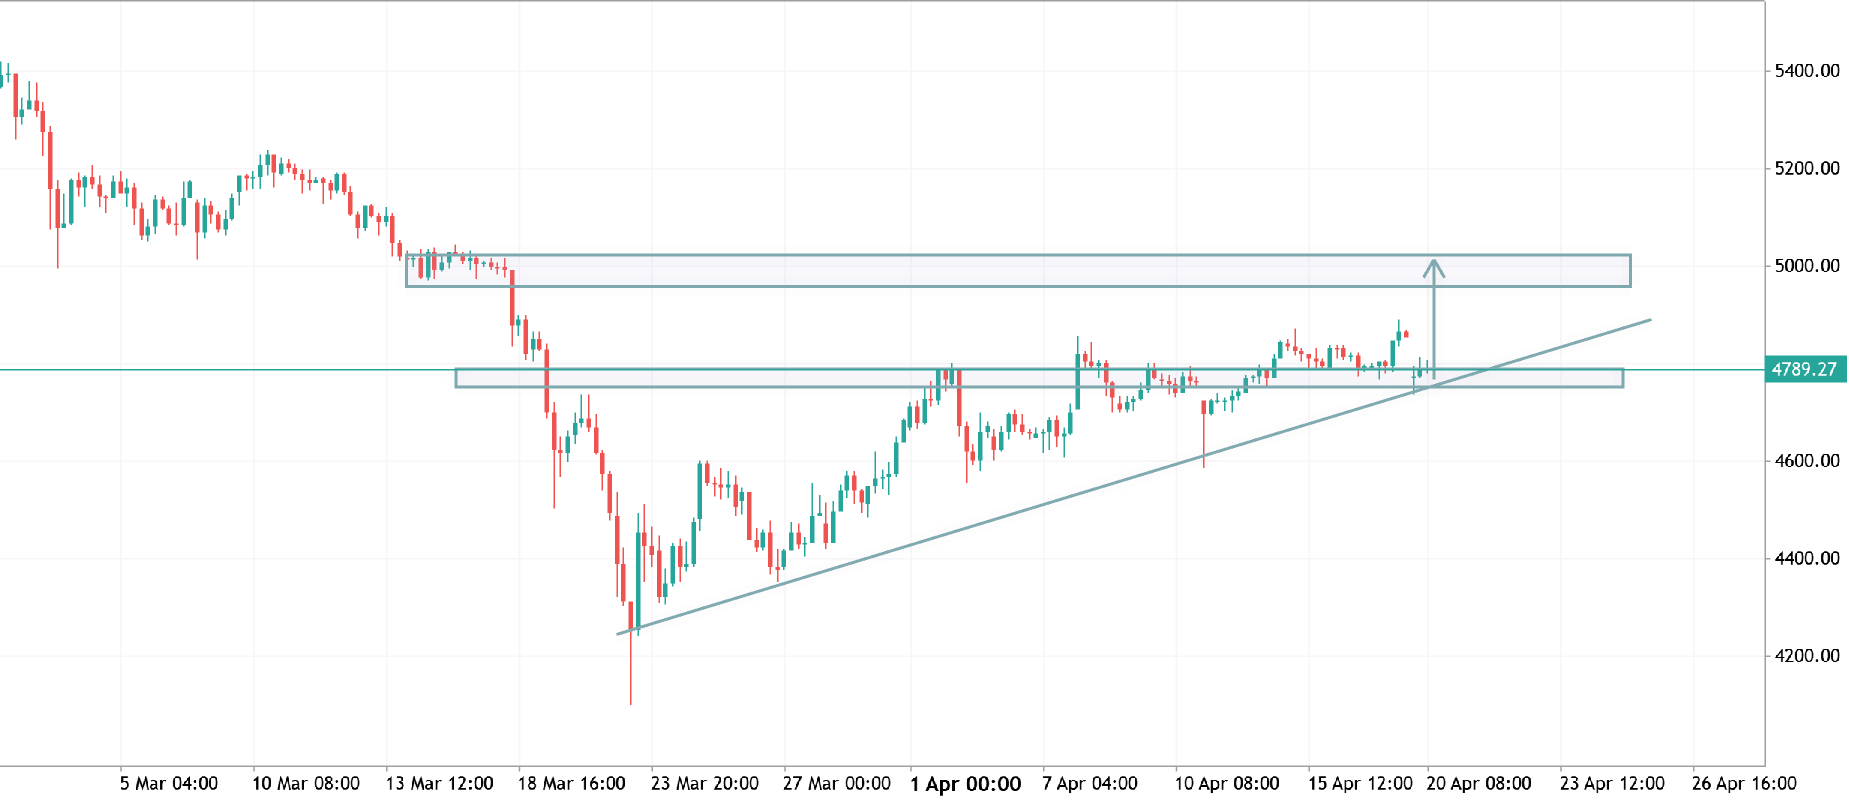
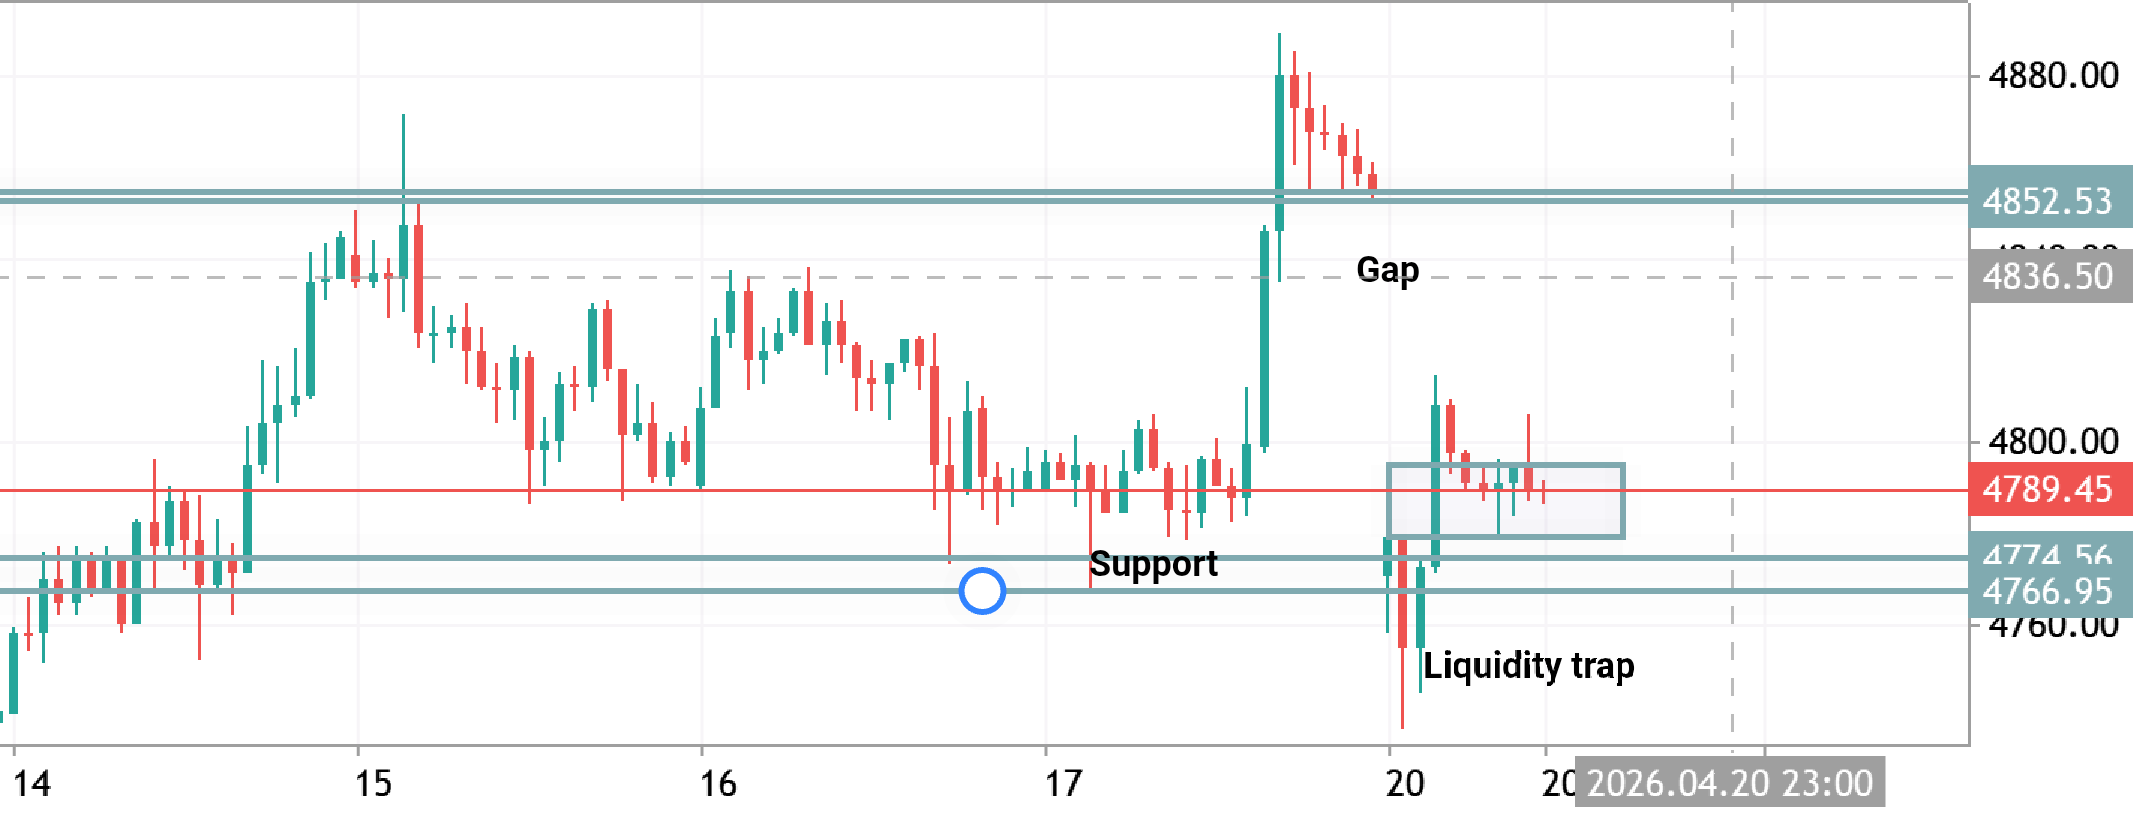
AMZN is recovering after a recent pullback and approaching a key resistance area. The current structure suggests buyers are attempting to regain control as momentum gradually improves. Bullish scenario: A breakout above recent highs could support continuation toward the next resistance levels. Strong trend structure remains intact while price stays above support. Bearish scenario: Rejection near resistance may trigger short-term profit taking. Broader market weakness could increase volatility in tech stocks. Key levels to watch: Support: recent consolidation zone Resistance: previous swing highs Momentum remains cautiously bullish while buyers continue defending higher lows.
AUDCHF Breakout Attempt Near Key Resistance AUDCHF Australian Dollar vs Swiss Franc

AUDCHF Breakout Attempt Near Key Resistance

AUDCHF is testing an important resistance zone after a steady recovery from recent lows. Price structure remains constructive, with buyers attempting to continue the short-term bullish momentum. Bullish scenario: A confirmed breakout above local resistance could open the path toward higher price levels. Momentum indicators continue supporting gradual upside movement. Bearish scenario: Failure to break resistance may lead to consolidation or a pullback toward support. Renewed demand for safe-haven assets could strengthen CHF and pressure the pair lower. Key levels to watch: Support: recent swing lows Resistance: current breakout zone The pair remains neutral-to-bullish while price holds above short-term support levels.
EURUSD Tests Resistance After Strong Recovery EURUSD Short Euro vs US Dollar

EURUSD Tests Resistance After Strong Recovery

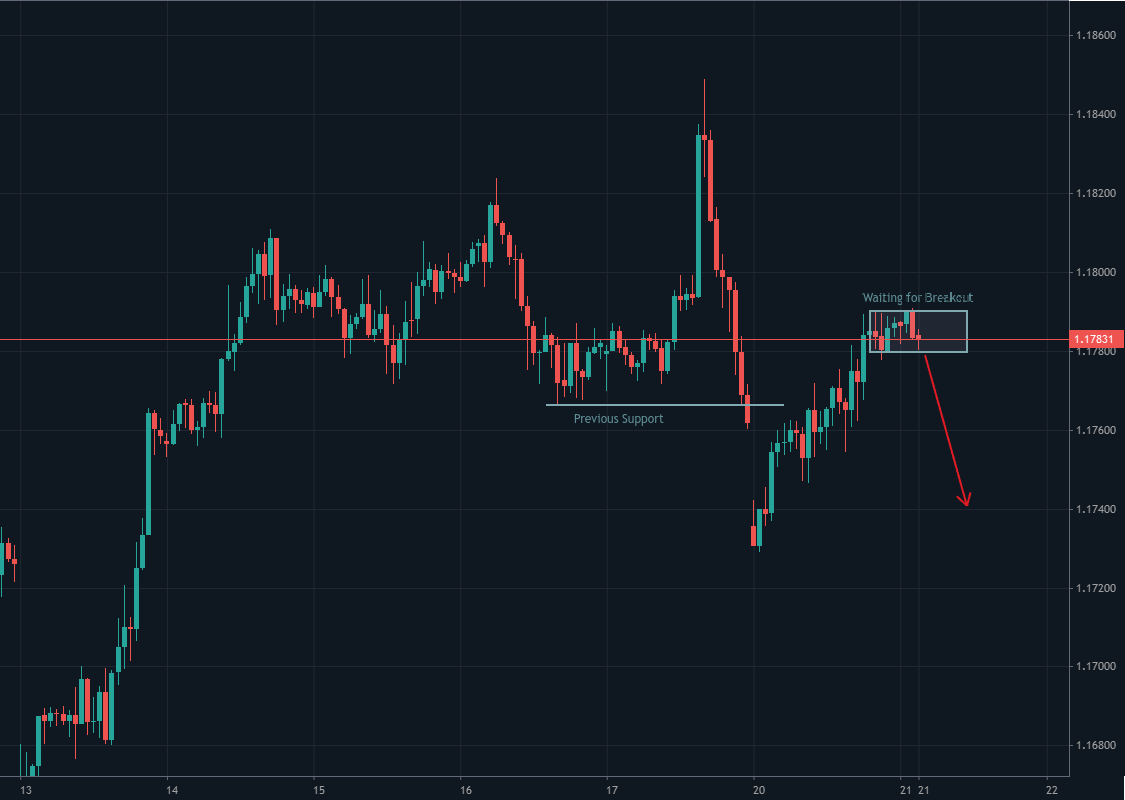
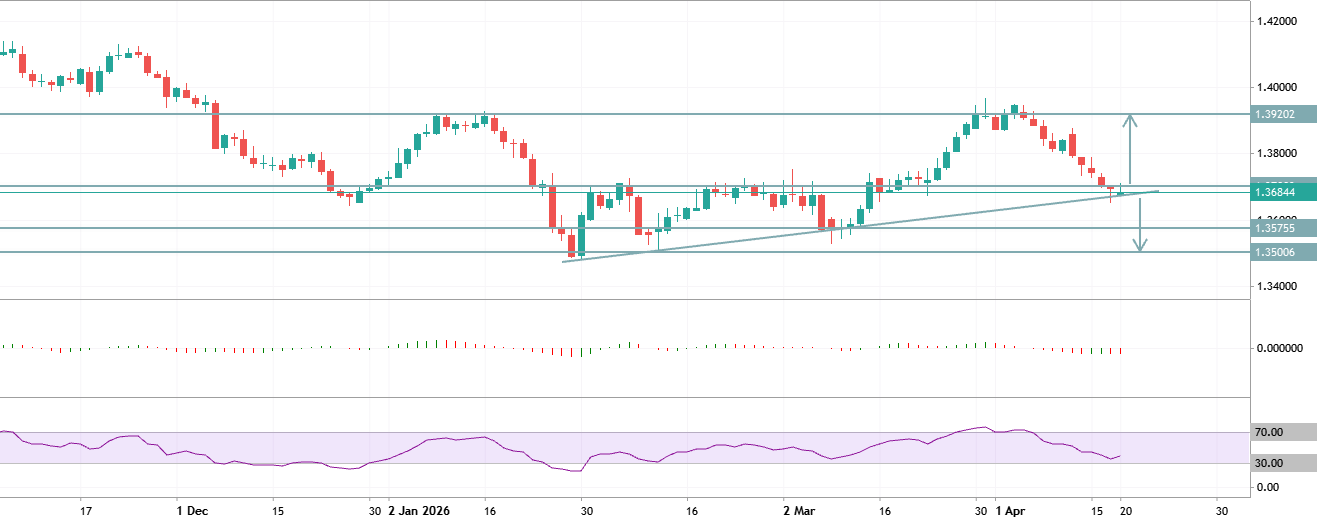
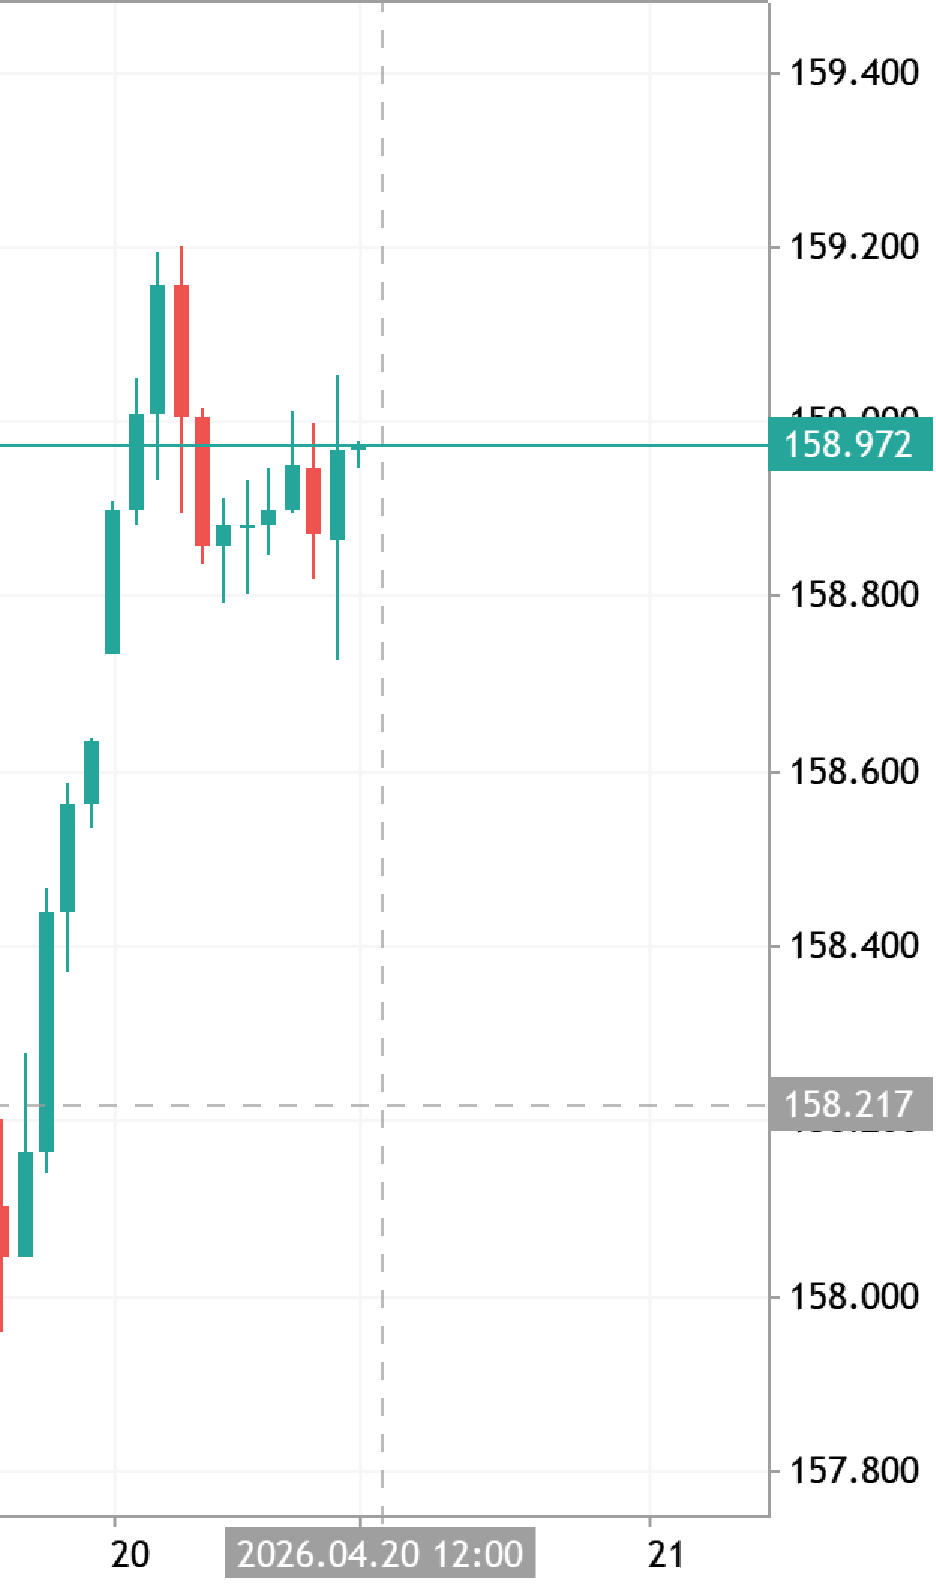
EURUSD continues recovering from recent lows and is now approaching an important resistance zone. Momentum remains positive in the short term, but buyers need a confirmed breakout to extend the move higher. Bullish scenario: A breakout above recent highs could strengthen bullish momentum and open the way toward higher resistance levels. Sustained buying pressure may support continuation of the current recovery trend. Bearish scenario: Rejection from resistance could trigger another pullback toward support levels. A stronger US dollar may increase downside pressure. Key levels to watch: Support: recent swing low area Resistance: local highs and short-term breakout zone Market structure remains cautiously bullish while price stays above near-term support.
GOOGL Holds Support After Recent Pullback GOOGL Short Alphabet Inc. - Class A Common Stock

GOOGL Holds Support After Recent Pullback

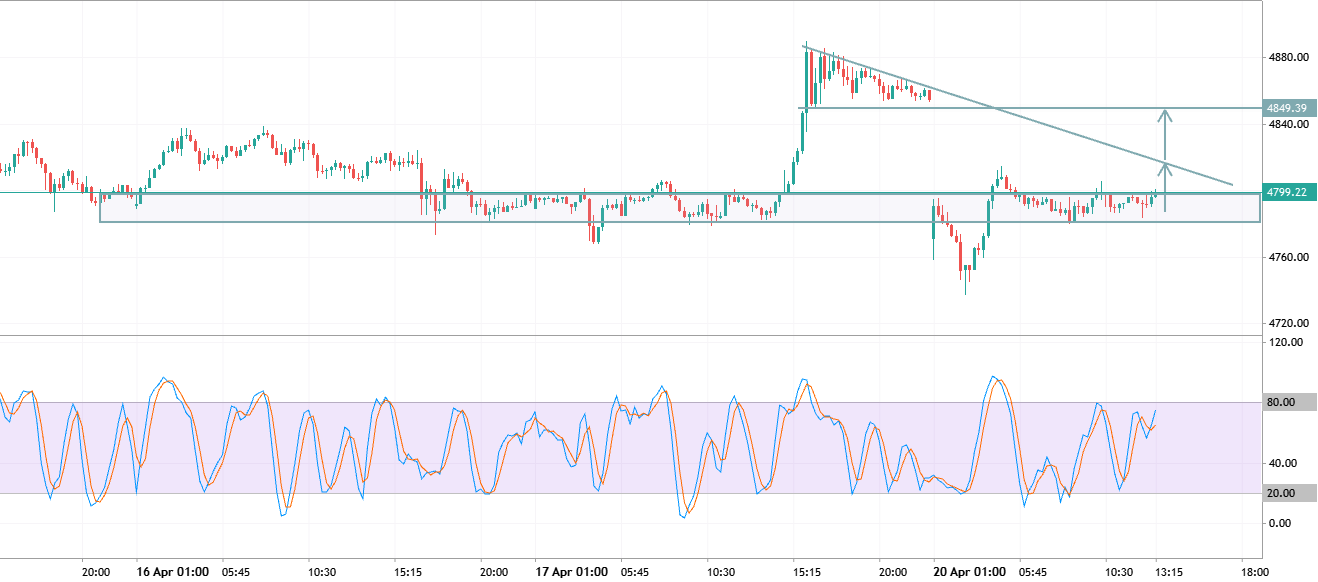
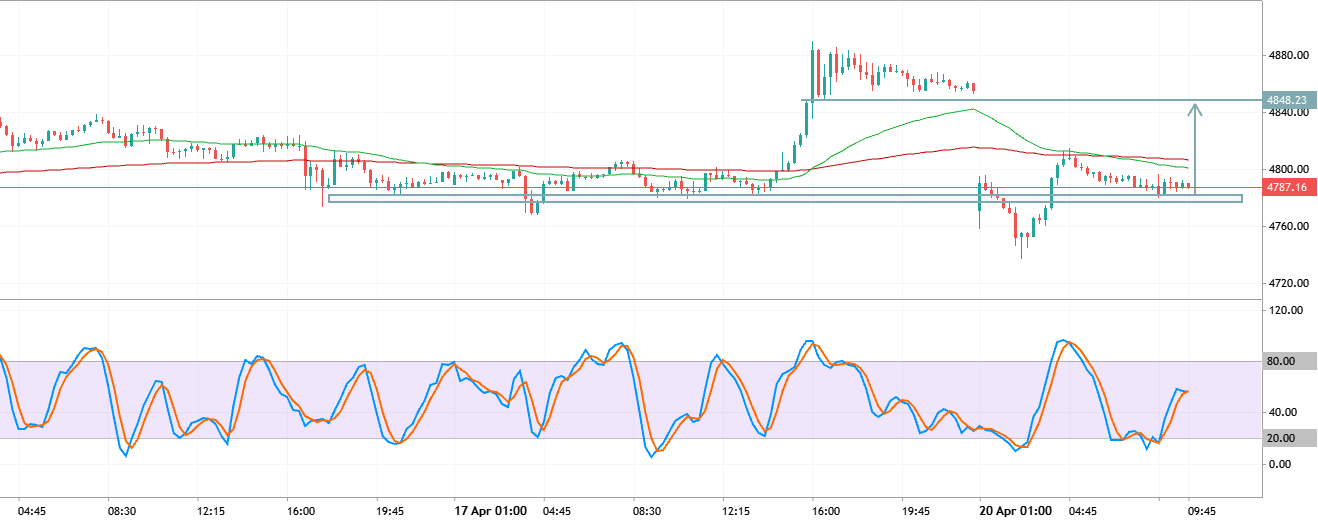
GOOGL is stabilizing near an important support area after a short-term correction. Buyers are still defending the broader uptrend, while price remains above key medium-term levels. Bullish scenario: A move above recent highs could confirm renewed upward momentum. Continued strength may push the price toward the next resistance zone. Bearish scenario: Losing current support may increase selling pressure and lead to a deeper retracement. Weak market sentiment in the tech sector could slow recovery attempts. Key levels to watch: Support: recent swing lows Resistance: previous local highs The current structure remains neutral-to-bullish while support levels continue holding. #GOOGL #Stocks #Alphabet #MetaTrader
BTCUSD TRADE IDEA BTCUSD Long Bitcoin vs US Dollar

BTCUSD TRADE IDEA

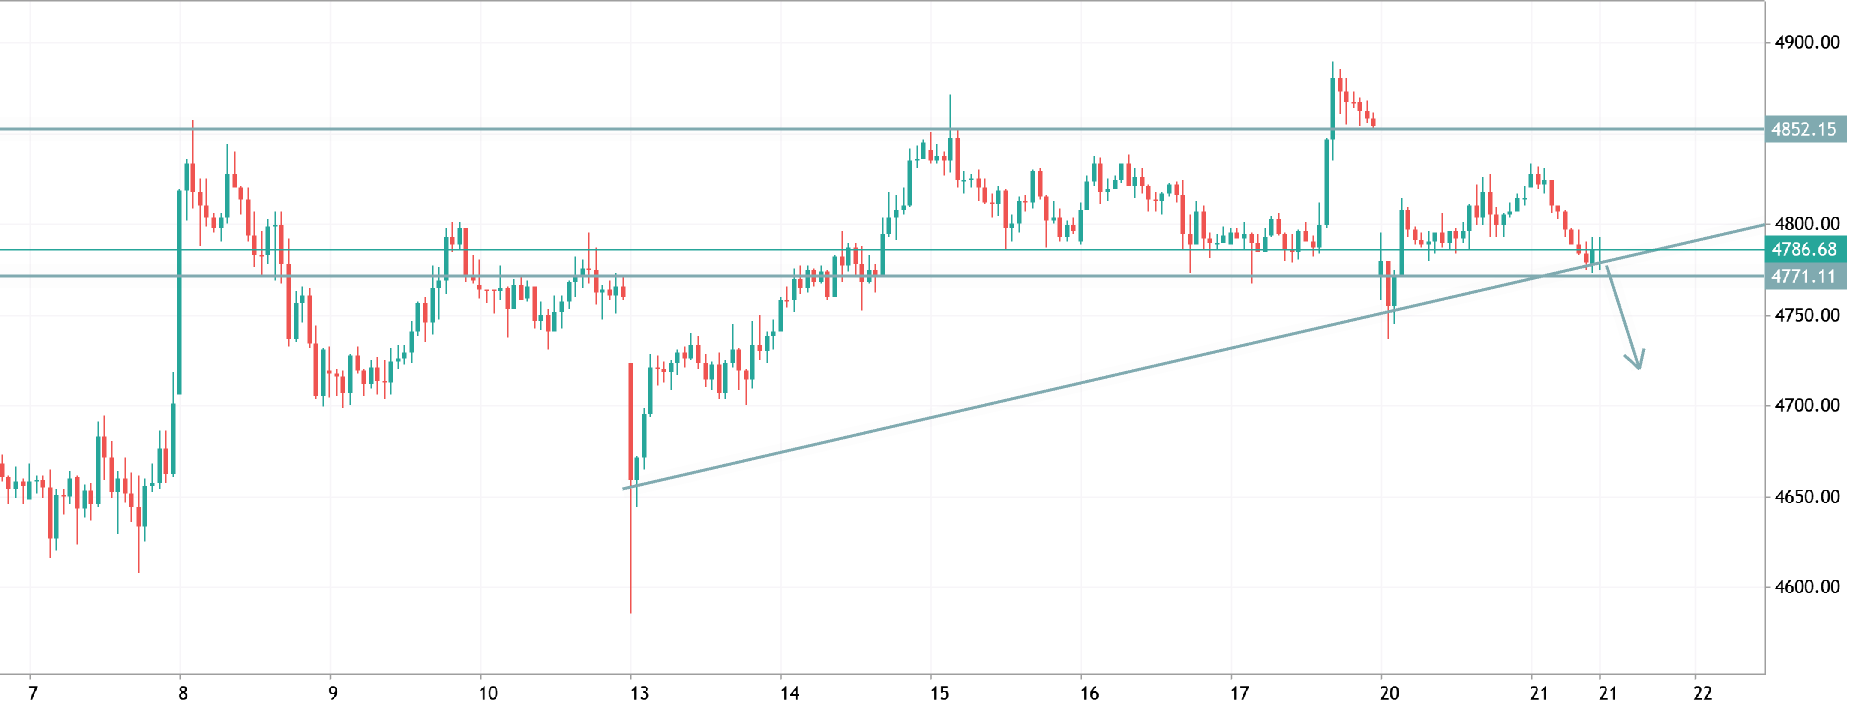
BTCUSD is currently consolidating above the 76,400–76,700 support zone after a strong bearish impulse from the 80K resistance area. Price reacted sharply from the upper supply zone near 80,300, confirming sellers are still active at higher levels. The recent structure shows accumulation around support, with buyers defending the lower range multiple times. If BTC maintains above 76,400 and breaks the short-term resistance around 77,600, momentum could continue toward the next supply zone at 79,000–79,500. Key levels: Support: 76,400 – 76,700 Intraday resistance: 77,600 Major resistance: 79,000 – 80,300 Bias: Short-term bullish recovery while price holds above support. A breakdown below 76,400 may trigger another bearish continuation toward 75,000. Trade idea: Bullish above 77,600 targeting
xauusd trade idea XAUUSD Long Gold vs US Dollar

xauusd trade idea

XAUUSD on the H4 chart remains under strong bearish pressure, but price is now reacting from a major support zone around 4457 – 4494 . The descending channel is still valid, however buyers are attempting a short-term recovery after repeated rejection from the lower boundary. The key resistance levels are: 4508 4544 A confirmed H4 candle close above 4508 could trigger bullish momentum toward 4544 , and if momentum continues, gold may extend toward the upper trendline resistance. Current structure suggests: Short-term: bullish correction Overall trend: bearish unless price breaks above the descending channel Bearish scenario: If XAUUSD fails to hold above 4494 and breaks below 4457 , sellers may regain control and push price toward lower liquidity zones. Trading idea: Buy only after
xauusd h4 analysis XAUUSD Gold vs US Dollar

xauusd h4 analysis

XAUUSD H4 Analysis 📊 Price respected the bearish trendline and rejected from resistance zone. Currently moving inside a strong bearish structure after liquidity grab near 4680 area. 🔹 Key Support: 4440 – 4480 🔹 Resistance Zone: 4560 – 4740 🔹 Bias: Bearish until strong bullish breakout Possible scenario: Price may retest support area first, then a corrective move toward resistance before next major direction. Smart money already showed rejection from premium zone. ⚡ #XAUUSD #Gold #Forex #SmartMoney #H4Analysis
XAUUSD TRADE IDEA XAUUSD Short Gold vs US Dollar

XAUUSD TRADE IDEA

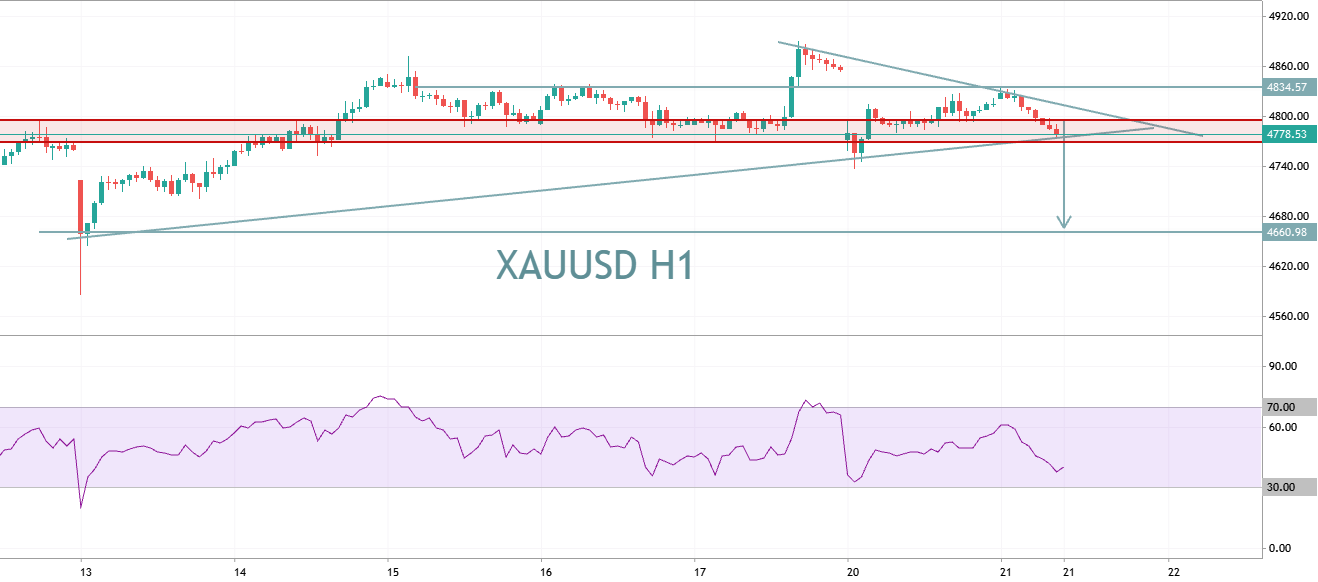
Gold remains in a short-term bearish structure after rejecting the 4700 resistance zone and continuing lower with strong momentum. Price is now trading near a critical support area around 4475–4480 , which is acting as the main reaction zone. The chart shows a possible bullish reversal setup forming near support: Immediate support: 4475 – 4432 Major resistance: 4510 – 4550 Overall trend: Bearish below 4550 If buyers defend the 4475 zone, XAUUSD could attempt a corrective bounce toward 4510 and possibly 4550 . However, failure to hold above support may trigger another selloff toward 4432 and lower. Trading Plan Buy scenario: Bullish confirmation above 4480 targeting 4510 / 4550 Sell scenario: Rejection from 4510 or breakdown below 4470 targeting 4432 Market sentiment remains cautious, and
GBPUSD TRADE IDEA GBPUSD Long Pound Sterling vs US Dollar

GBPUSD TRADE IDEA

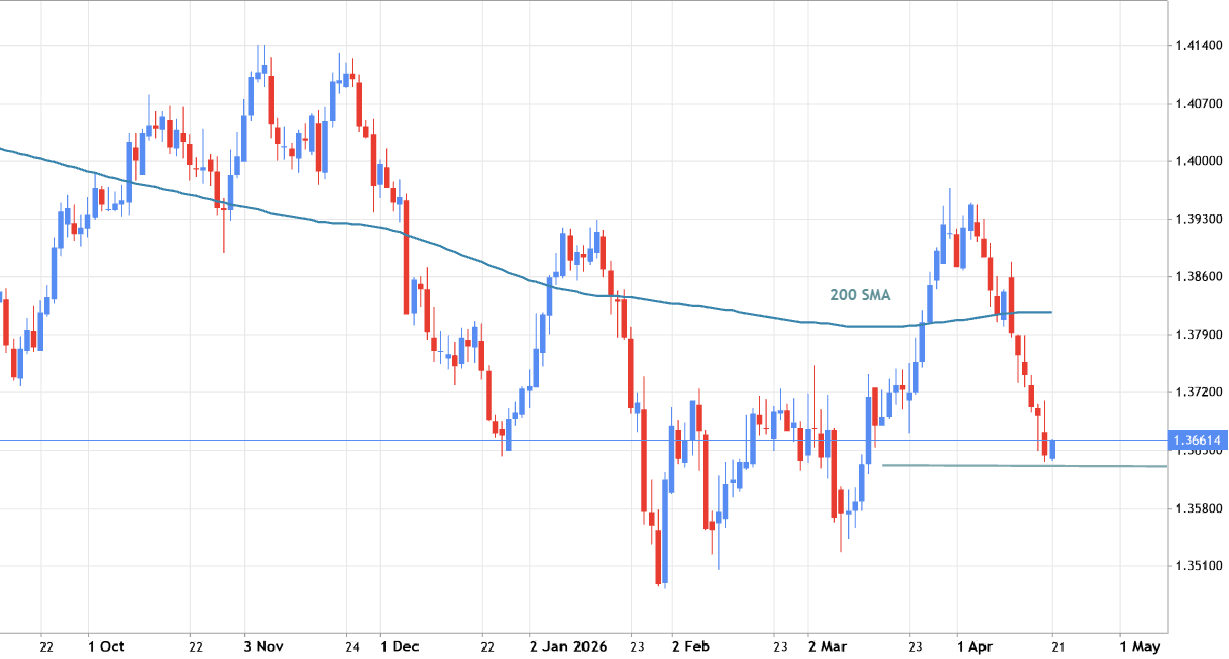
GBP/USD is currently showing a strong bearish correction after rejecting the 1.3580 resistance zone. Price broke below the 1.3470 and 1.3380 support levels with strong momentum, indicating short-term seller control. The pair is now reacting from the 1.3300–1.3280 demand zone, where a temporary bullish pullback is developing. As long as price remains below 1.3470, the overall structure stays bearish. Key Levels Resistance: 1.3380 → 1.3440 → 1.3470 Support: 1.3300 → 1.3280 Trading Scenario Bullish recovery possible toward 1.3440 if buyers hold above 1.3300. Rejection from resistance could create another selling opportunity. A breakdown below 1.3280 may continue the bearish move toward lower support levels. Market Bias: Short-term bearish with intraday corrective rebound potential.
BTCUSDTRADE IDEA BTCUSD Long Bitcoin vs US Dollar

BTCUSDTRADE IDEA

BTCUSD is currently reacting from a strong demand zone around 76,400 – 77,200 , where buyers stepped in after a sharp bearish impulse. Price shows early signs of stabilization with small bullish recovery candles forming near support. The market structure remains short-term bearish below the 79,200 – 79,500 resistance zone. However, the current bounce suggests a possible retracement toward that liquidity area before the next major move. Key Levels Support: 76,400 – 77,200 Immediate Resistance: 79,200 – 79,500 Major Resistance: 80,300 – 80,400 Bullish Scenario If BTC closes above 79,500 , momentum could continue toward 80,300+ and potentially retest recent highs. Bearish Scenario Failure to break the resistance zone may trigger another rejection, sending price back toward 76K support or