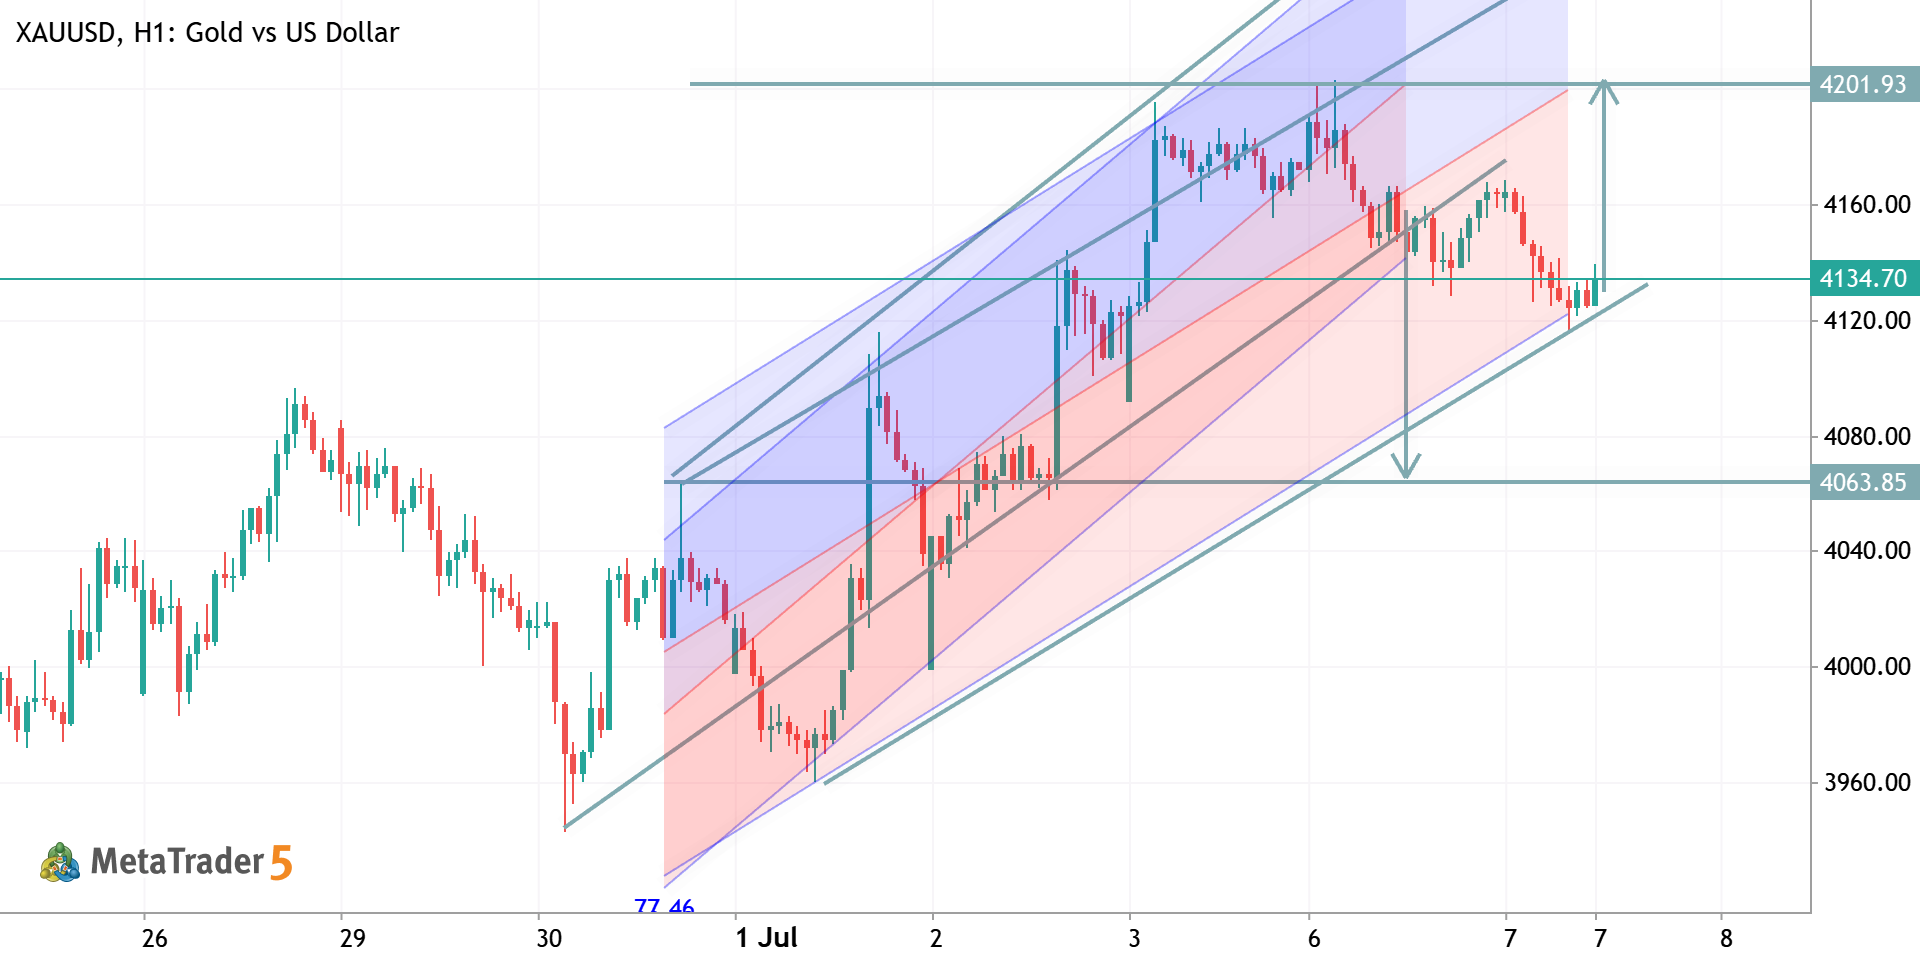
XAUUSD – Liquidity Sweep Strategy XAUUSD Gold vs US Dollar

XAUUSD – Liquidity Sweep Strategy

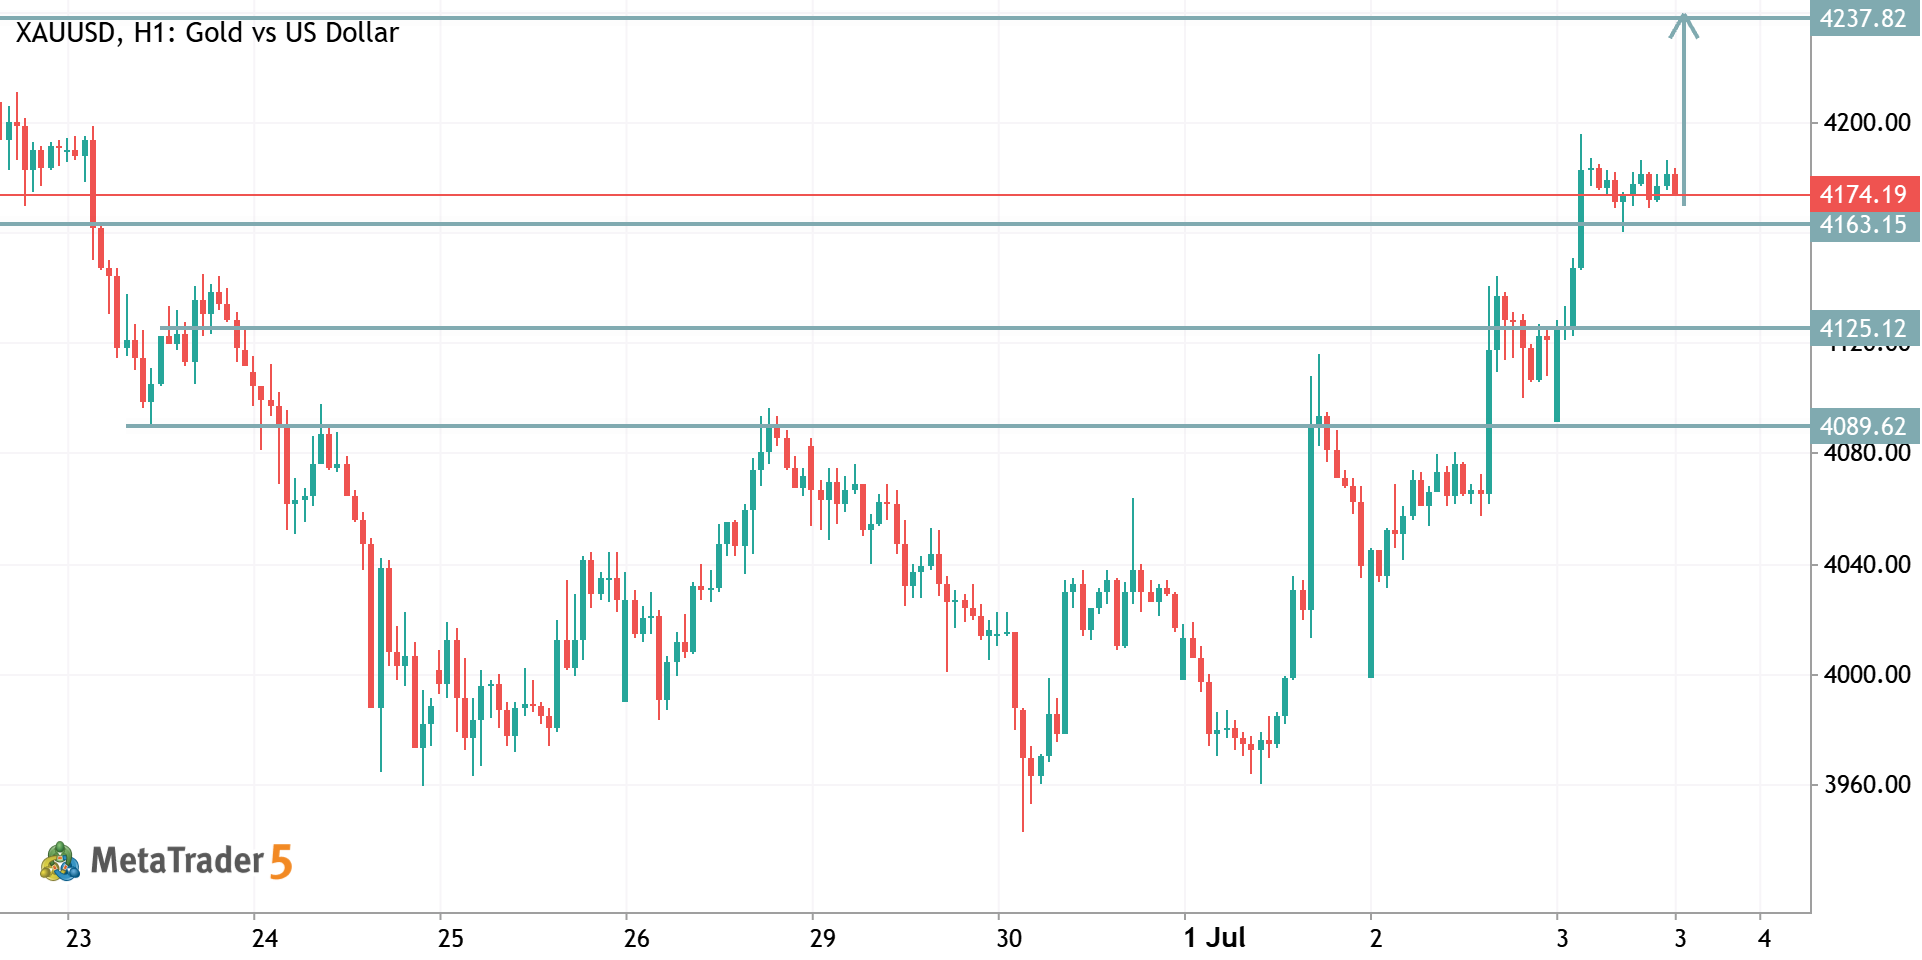
XAUUSD (Gold) Two-Way Setup – Liquidity Sweep & Price Action Confirmation and XAUUSD Buy Setup – After Liquidity Sweep 🔴 Sell Zone: 4608 – 4612 SL: 4620 🎯 Targets: 4600 – 4585 – 4570 – 4545 🟢 After the downside liquidity sweep, watch for bullish price action. Buy Zone: 4555 – 4545 SL: 4530 🎯 Targets: 4565 – 4585 – 4600 – Open 📚 Educational Idea: The main concept is to wait for liquidity to be taken before entering a trade. If Gold moves into the 4608–4612 area and shows bearish price action after a liquidity sweep, the sell setup becomes active. If price continues falling toward 4555–4545, avoid entering immediately. Wait for liquidity to be swept below the zone and then look for clear bullish price action confirmation. Once buyers regain control, the buy setup can be considered
USDJPY Market Story: Local Bullish Development Meets Higher-Timeframe Conflict USDJPY US Dollar vs Yen

USDJPY Market Story: Local Bullish Development Meets Higher-Timeframe Conflict

Current Context At the time of the Aviation Landing export, USDJPY was showing clearer local bullish development, but the higher-timeframe structure remained unresolved. In the previous observation, downside pressure had become the main developing theme, although confirmation was still missing. The current export shows a change in that story: bullish evidence has rebuilt across D1, H4, H1 and M5. W1 still retains a higher-high / higher-low swing structure. However, its shorter-term condition remains weaker, with a bearish 5/20 relationship and a strongly falling 5SMA. Meanwhile, D1 has moved into a more constructive Bought Phase with a bullish 5/20 relationship and rising 5SMA. Yet its Dow structure remains a contracting range with a lower high and higher low. The key question is
USDJPY Market Story: An Upside Challenge Develops, but Acceptance Is Still Missing USDJPY US Dollar vs Yen

USDJPY Market Story: An Upside Challenge Develops, but Acceptance Is Still Missing

Current Context USDJPY is developing an important test of its recent compression area, but the broader market picture remains mixed. The higher-timeframe structure still matters. On W1, the confirmed Dow-style sequence remains upward, with higher highs and higher lows still intact. However, the shorter-term weekly moving-average picture is corrective: the 5SMA is falling strongly, price is below both the 5SMA and 20SMA, and the 5/20 relationship remains bearish. In other words, the longer-term structure has not broken down, yet the market is still working through meaningful corrective pressure. D1 adds another layer to that conflict. Daily momentum has recovered into a Bought Phase, the 5SMA is rising strongly, and the 5/20 relationship is bullish. However, the confirmed daily structure
XAUUSD (Gold) Buy Setup – Liquidity Sweep Confirmation XAUUSD Long Gold vs US Dollar

XAUUSD (Gold) Buy Setup – Liquidity Sweep Confirmation

XAUUSD Buy Signal Buy Zone: 4565 – 4655 Stop Loss: 4540 🎯 Targets: TP1: 4575 TP2: 4590 TP3: 4610 Extended Target: Open 📈 Gold may first sweep liquidity and create a drawdown before reaching the key buying area. The preferred entry is after the liquidity sweep is cleared and fresh bullish price action confirms that buyers are taking control. If bullish confirmation develops from the zone, Gold could move toward 4575, followed by 4590 and 4610. If momentum remains strong, the remaining position can be kept open for further upside. Consider securing partial profits at each target and managing risk carefully after confirmation. Risk Disclaimer: Trading forex and commodities involves substantial risk. Always use proper risk management and never risk more than you can afford to lose.
BTCUSD Short Setup – Bearish Momentum Continuation BTCUSD Short Bitcoin vs US Dollar

BTCUSD Short Setup – Bearish Momentum Continuation

BTC/USDT SHORT Signal Entry Zone: 78,450 – 78,650 Stop Loss: 78,800 🎯 Targets: TP1: 77,800 TP2: 77,200 TP3: 76,500 TP4: 75,700 📉 BTC/USDT is approaching the 78,400–78,600 sell zone, where sellers may step in and trigger a potential bearish move. If price holds below this area and selling pressure strengthens, Bitcoin could move toward 77,800, followed by 77,200, 76,500, and the extended target at 75,700. Consider securing partial profits at each target and managing the position carefully as the trade moves in your favor. ⚠️ Risk Disclaimer: Cryptocurrency trading involves substantial risk and high volatility. Always use proper risk management and never risk more than you can afford to lose.