CADJPY - Possible Daily Breakdown with the Bearish Reversal CADJPY Short Canadian Dollar vs Yen

CADJPY - Possible Daily Breakdown with the Bearish Reversal

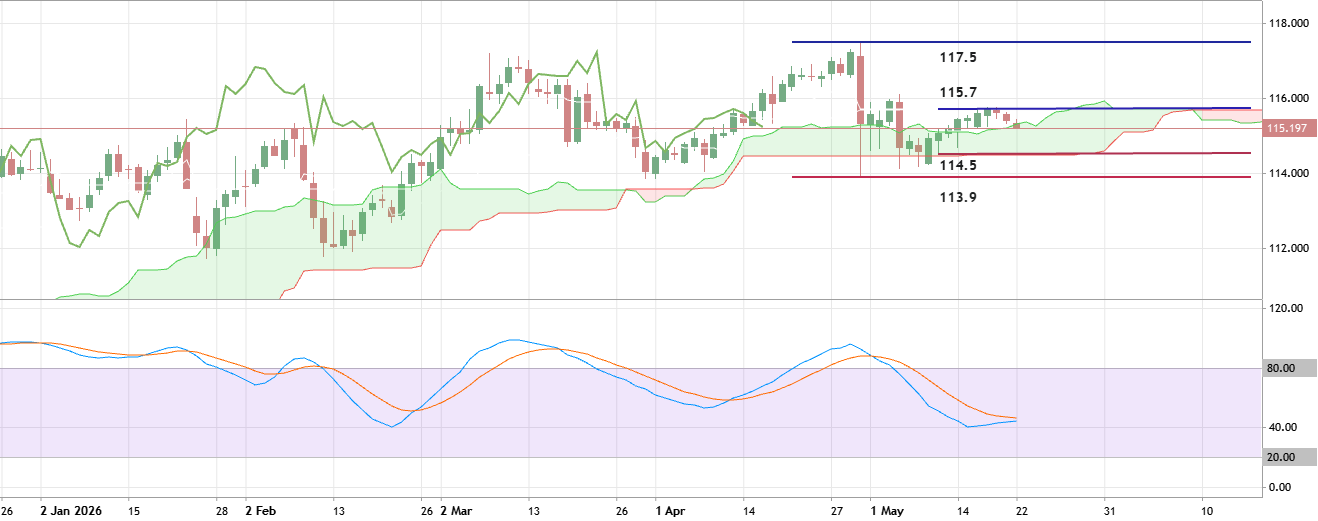
Daily price is located above and near Ichimoku cloud in the bullish area of the chart. The price was bounced from resistance level at 115.7 to below to cross the Ichimoku cloud border from above. Besides, the Chinkou Span line of Ichimoku indicator is breaking the historical price to below for the good breakdown to be started, and Stochastic oscillator is indicating the downtrend in the near future. If the price breaks support level at 114.5 to below so the primary bearish reversal will be started with 113.9 as a possible target. If the price crosses resistance at 115.7 to above so the primary bullish trend will be resumed with 117.5 possible target. Alternatively, the price will be on secondary ranging within s/r levels waiting for direction. Trading Summary : possible daily breakdown
GBPUSD TRADE IDEA GBPUSD Long Pound Sterling vs US Dollar

GBPUSD TRADE IDEA

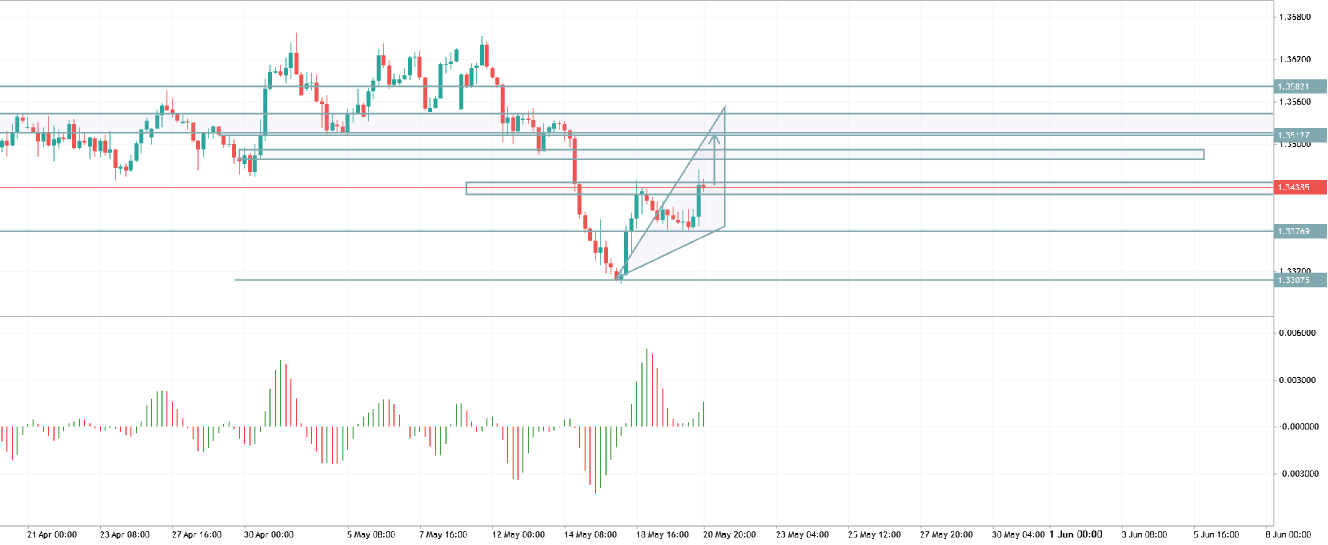
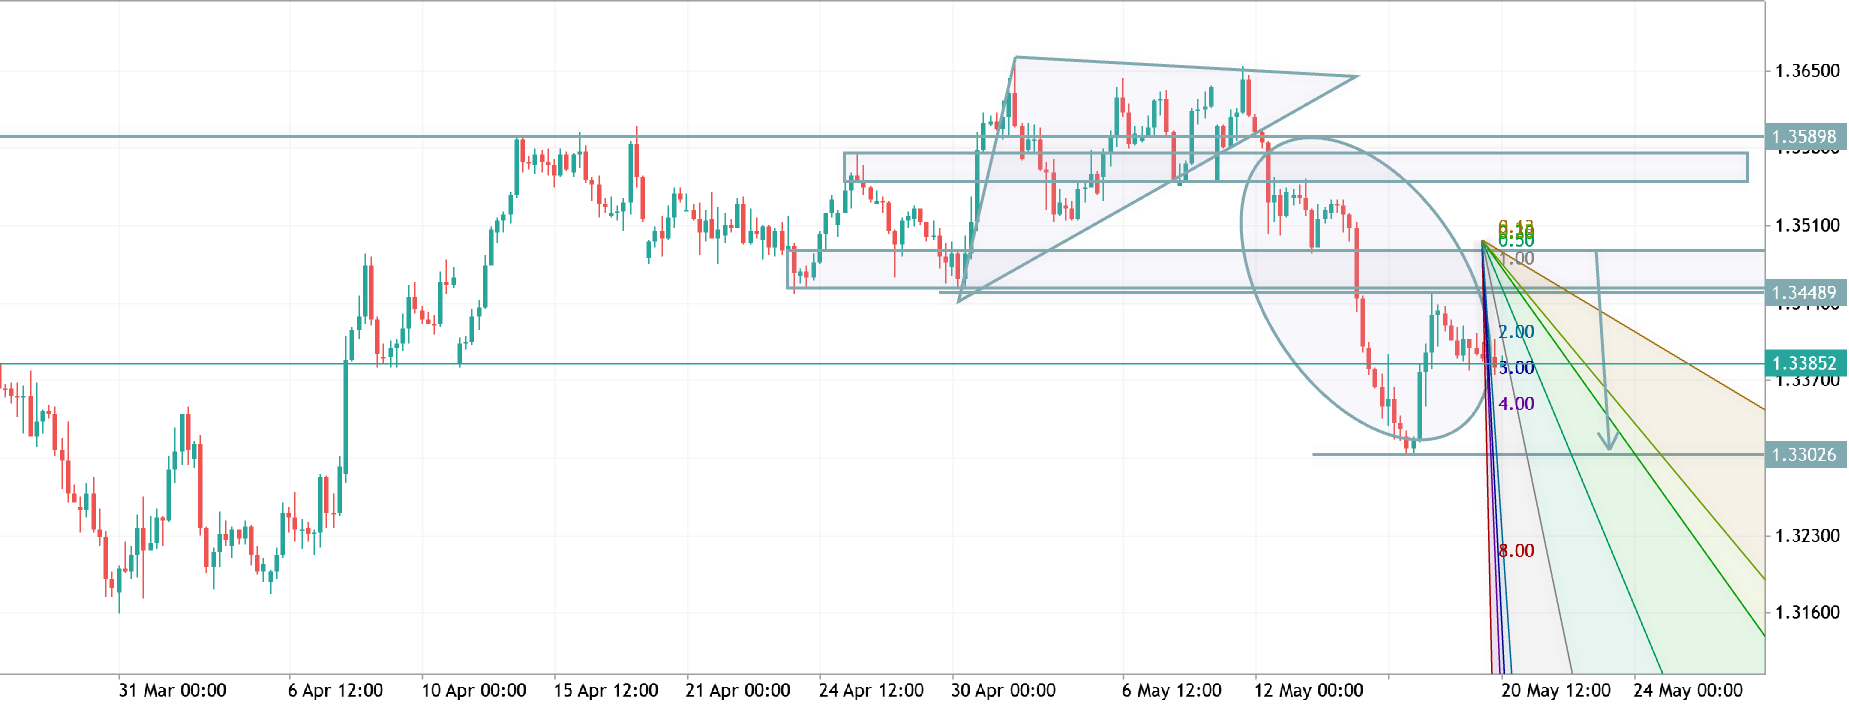
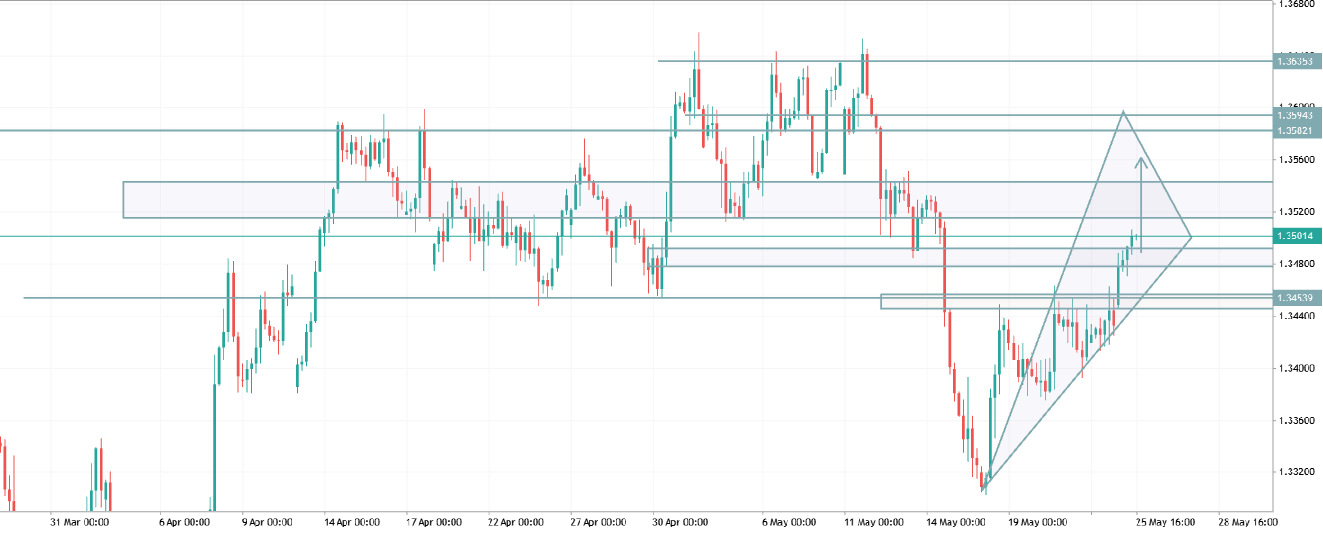
GBP/USD is showing a short-term bullish recovery after rejecting the 1.3300 support zone. Price formed a bullish ascending triangle/wedge structure and is currently attempting a breakout above the 1.3430 resistance area. Bullish Scenario: A confirmed H4 close above 1.3430–1.3450 could push price toward 1.3510 and potentially 1.3580 resistance levels. Momentum is improving after the sharp bearish correction, and buyers are defending higher lows. Bearish Scenario: If price fails to hold above 1.3400 and breaks below the rising trendline, GBP/USD may revisit 1.3360 and 1.3300 support again. Key Resistance: 1.3430 → 1.3510 → 1.3580 Key Support: 1.3360 → 1.3300 Current structure favors cautious bullish continuation while price remains above the ascending support trendline.
eurusd h4 analysis EURUSD Euro vs US Dollar

eurusd h4 analysis

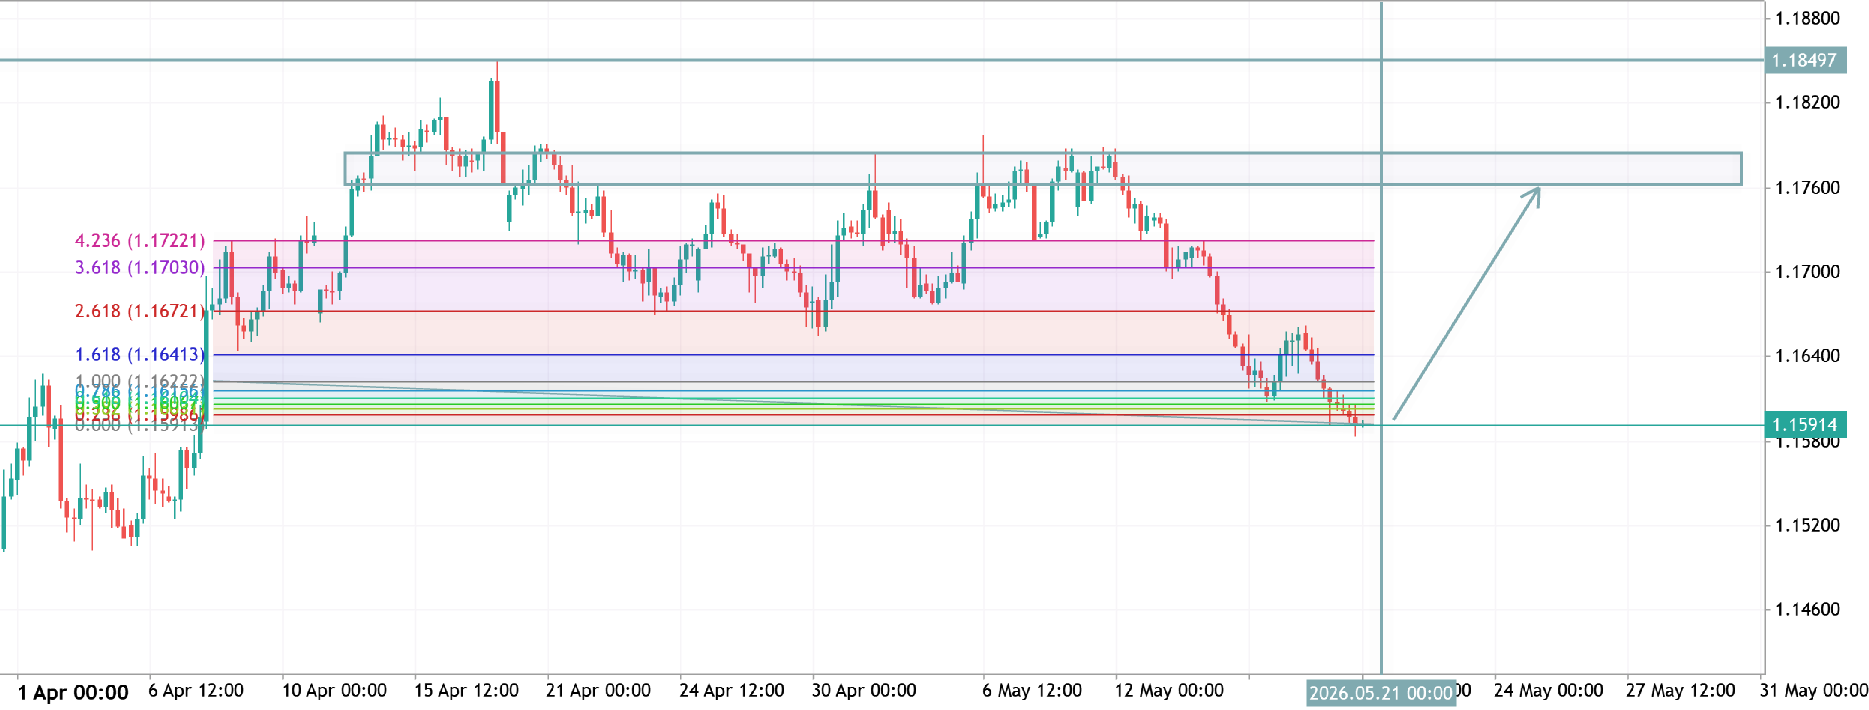
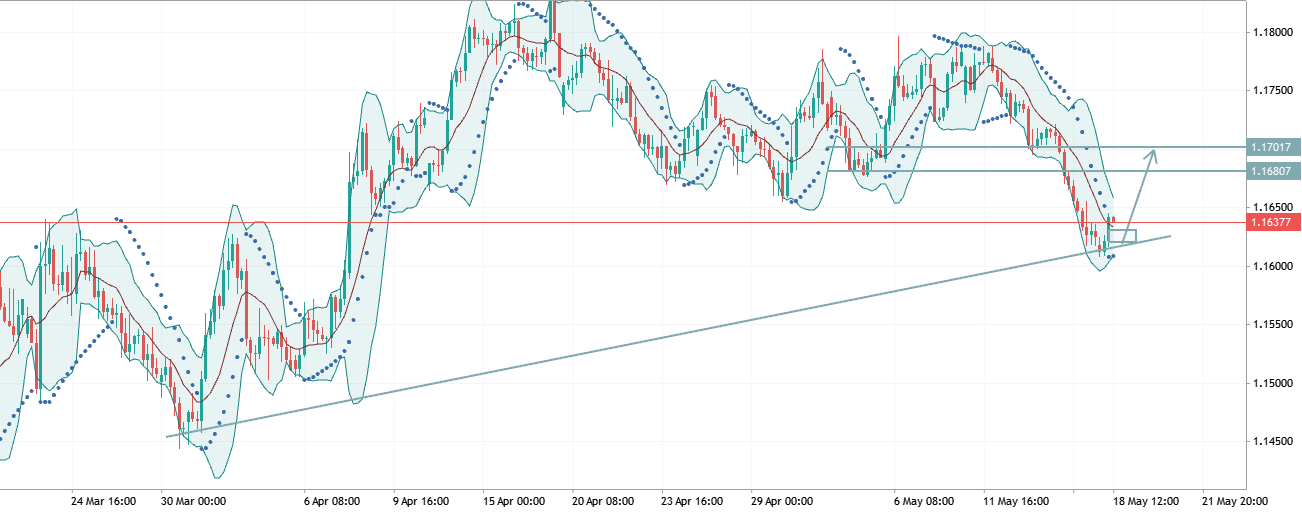
EURUSD H4 Analysis 📊 Price tapped a strong demand/support zone around 1.1590 – 1.1560 after a bearish move. Current structure suggests a possible bullish rebound if buyers maintain this area. 🔹 Key resistance: 1.1700 – 1.1760 🔹 Bullish confirmation above minor resistance could trigger continuation upward. 🔹 Bias remains cautiously bullish while price holds above support. 📈 Expected scenario: retracement → bullish momentum toward higher resistance zone. ⚠️ Risk management is essential — wait for confirmation before entry.
gbpusd h4 analysis GBPUSD Pound Sterling vs US Dollar

gbpusd h4 analysis

GBPUSD H4 Analysis 📊 Price broke below the ascending structure after multiple rejections from resistance zone. Bearish momentum remains strong while market trades inside a descending channel. 🔹 Resistance Zone: 1.3440 – 1.3520 🔹 Support Targets: 1.3300 – 1.3160 🔹 Bias: Bearish continuation Possible scenario: A short-term pullback toward resistance is possible before sellers continue targeting lower liquidity areas. Market structure still favors downside pressure. ⚡ #GBPUSD #Forex #PriceAction #SmartMoney #H4Analysis
EUR/USD – Bearish Structure Under Resistance EURUSD Short Euro vs US Dollar

EUR/USD – Bearish Structure Under Resistance

EUR/USD – Bearish Structure Under Resistance Trend: Lower highs forming → descending trendline intact (bearish pressure) Key Zone: 1.1780 – 1.1820 (strong resistance + rejection area) Confirmation: Price failing to break above zone + respecting trendline Sell Trigger: Break below 1.1700 support (clean bearish momentum) Targets: 1.1550 1.1400 (major support) ❌ Invalidation: Sustained close above 1.1820 (trendline breakout) — Clean setup: rejection + structure = downside continuation bias.