
BGC
#1310
BGC Group, Inc. - Class A Common Stock
11.0 2 USD
+0.01%
セクター: 金融
ベース: USD
利益通貨: USD
日中レンジ
1年のレンジ
1日の変化
+0.73%
月次変化
-7.63%
6か月変化
+23.27%
1年の変化
+8.15%
以前の終値
10.9 4
Open
11.0 1
安値
10.9 4
High
11.0 6
ボリューム
297
Financials
値 Q1, 25Q2, 25Q3, 25Q4, 25Q1, 26 TTM
ニュース
BGCが2025年第4四半期の見通しを再確認
バンク・オブ・アメリカ、AI以外の16銘柄の投資機会を提示
BGCグループ、2025年第3四半期:電子取引プラットフォームのシェア拡大により収益31%増
【決算速報】Bgc Group、売上高は予想を上回り、利益は予想を上回る結果に
BGCグループ、2025年第2四半期:電子取引の伸長により過去最高の収益が42%増加
ハワード・ルトニック、BGCグループ株を8260万ドルで売却
キャンター・フィッツジェラルド、BGCグループ株を8,260万ドル相当購入
BGCグループ、ハワード・ラトニックの持分売却完了、ブランドン・ラトニックが支配権獲得
BGCグループ、7億ドルのシニアノート交換オファーを延長
チャート&アイデア
BGC - Daily Trading Forecast
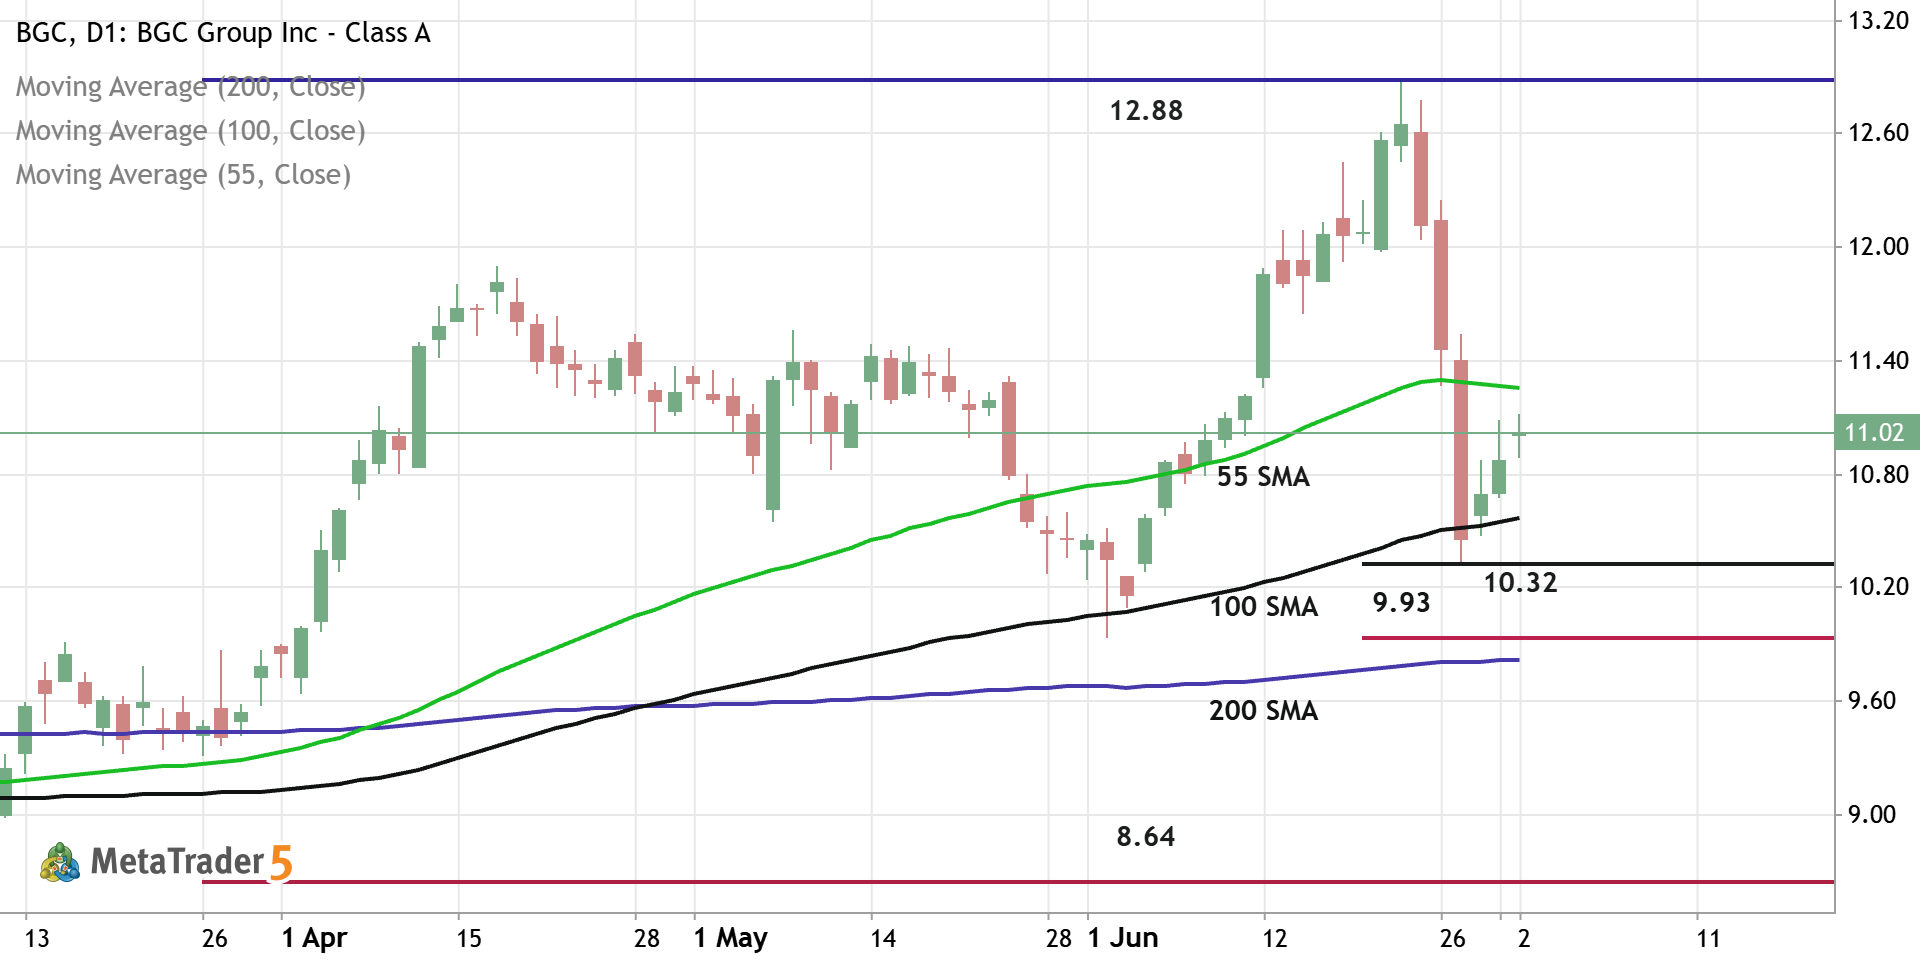
Daily price is located above 200-SMA in the bullish area of the chart. The price was bounced from support level at 10.32 and from 100-SMA to above for the pimary bullish trend to be continuing. If the price breaks 55-SMA to above so the strong bullish trend will be resumed with 12.88 resistance as the global possible target. If the price crosses support level at 9.93 together with 200-SMA to below so the primary bearish reversal will be started with 8.64 support level as the global possible target. Aternatively, the price will be on secondary ranging to be near and above 200 SMA waiting for direction. Trading Summary : waiting for direction
0 

The BGC doesn’t have other trading ideas at this time
Browse ready-made trading ideas or select a symbol and create your own
Go to Charts and Trading Ideas