

BGC
#1257
BGC Group, Inc. - Class A Common Stock
12.1 2 USD
0.00%
Market Price
Sector: Financial
Base: USD
Profit Currency: USD
Daily Range
Year Range
Daily Change
+0.17%
Monthly Change
+3.77%
6 month change
+28.94%
Year Change
+25.60%
Previous Close
12.1 0
Open
12.1 2
Low
12.1 2
High
12.1 2
Volume
127
Financials
Value Q1, 25Q2, 25Q3, 25Q4, 25Q1, 26Q2, 26 TTM
News
SNEX Q3 Earnings Top on Commercial and Institutional Gains, Stock Dips
BGC Q2 Earnings Beat on Record Revenues, Stock Falls as Costs Rise Y/Y
BGC Group (BGC) Beats Q2 Earnings and Revenue Estimates
Robinhood Markets, Inc. (HOOD) Q2 Earnings and Revenues Top Estimates
StoneX's High ROE Supports the Bull Case: Is It Sustainable?
Should Investors Consider StoneX Stock After Its Impressive YTD Rally?
Fanatics Buys CFTC-Registered Exchange in Prediction Markets Land Grab
Fanatics Acquires Regulated Exchange, Bets on Event Contracts and Sports Prediction Market
BGC Group (BGC) Reports Next Week: Wall Street Expects Earnings Growth
BGC Group: Revenue Growth And Margin Expansion Support Further Upside (NASDAQ:BGC)
Raymond James Financial, Inc. (RJF) Tops Q3 Earnings and Revenue Estimates
Charts & Ideas
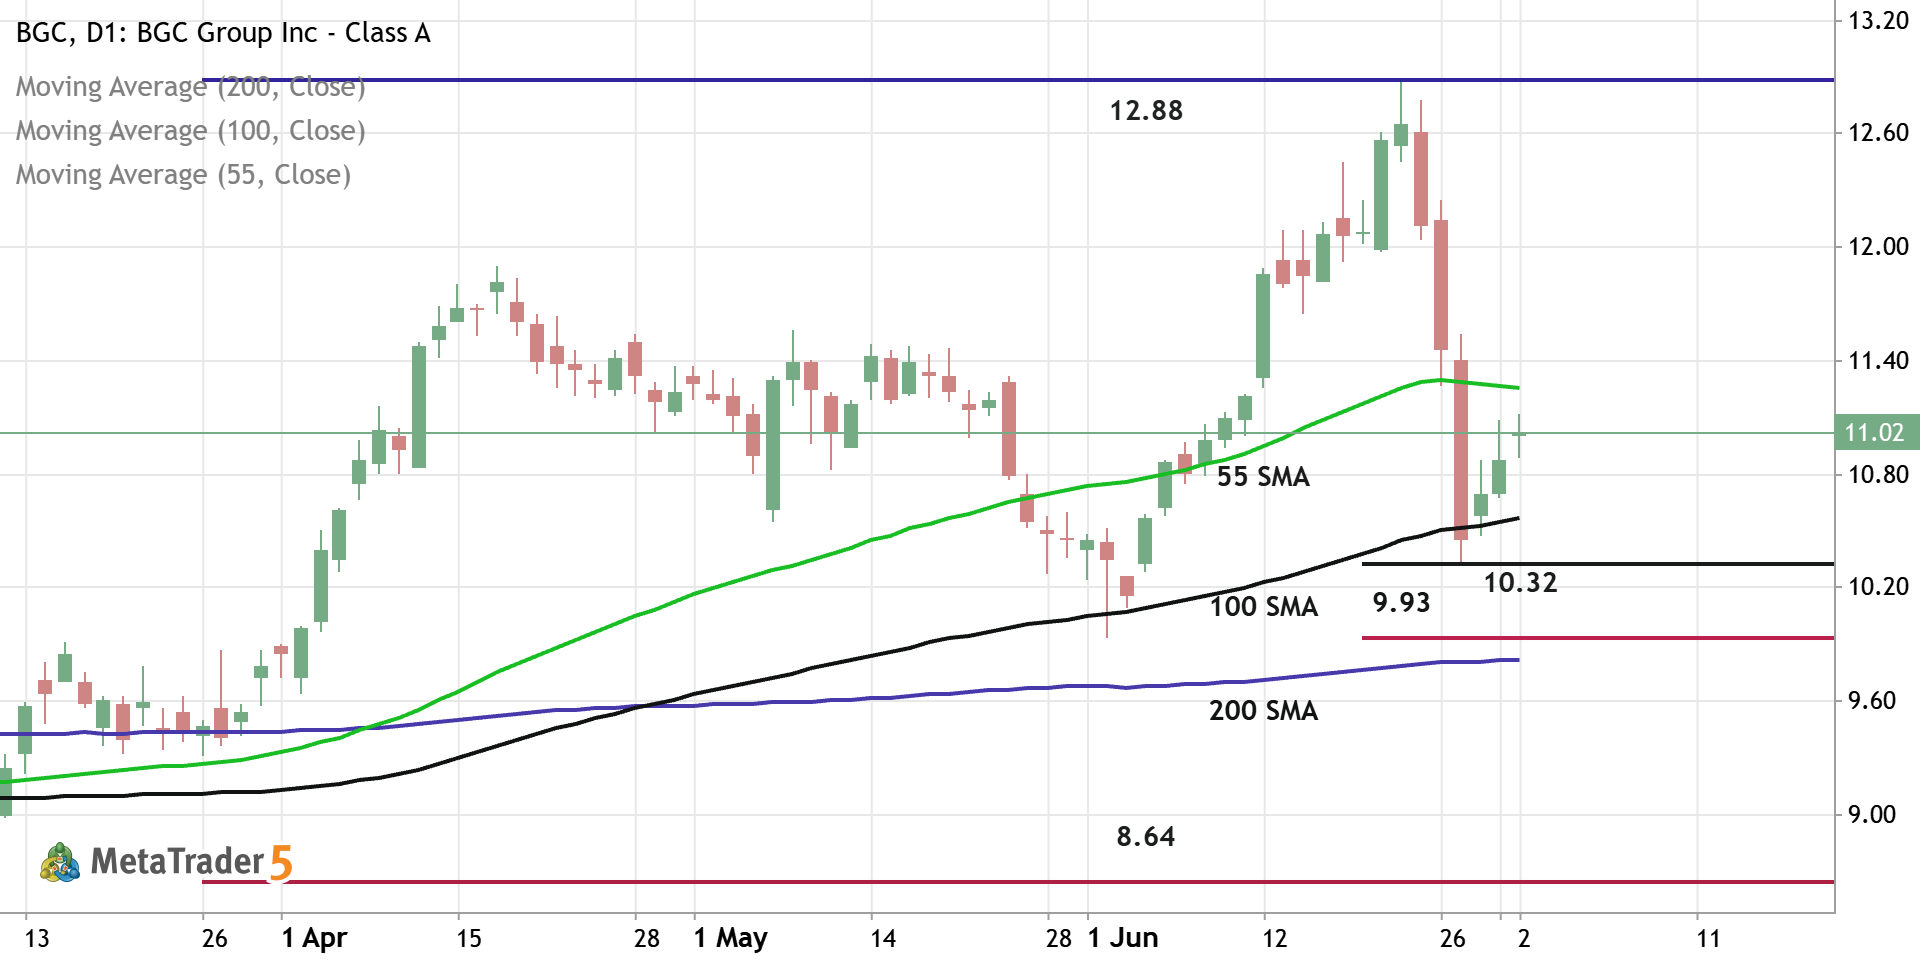
BGC - Daily Trading Forecast
Daily price is located above 200-SMA in the bullish area of the chart. The price was bounced from support level at 10.32 and from 100-SMA to above for the pimary bullish trend to be continuing. If the price breaks 55-SMA to above so the strong bullish trend will be resumed with 12.88 resistance as the global possible target. If the price crosses support level at 9.93 together with 200-SMA to below so the primary bearish reversal will be started with 8.64 support level as the global possible target. Aternatively, the price will be on secondary ranging to be near and above 200 SMA waiting for direction. Trading Summary : waiting for direction


The BGC doesn’t have other trading ideas at this time
Browse ready-made trading ideas or select a symbol and create your own
Go to Charts and Trading Ideas