
チャート&アイデア
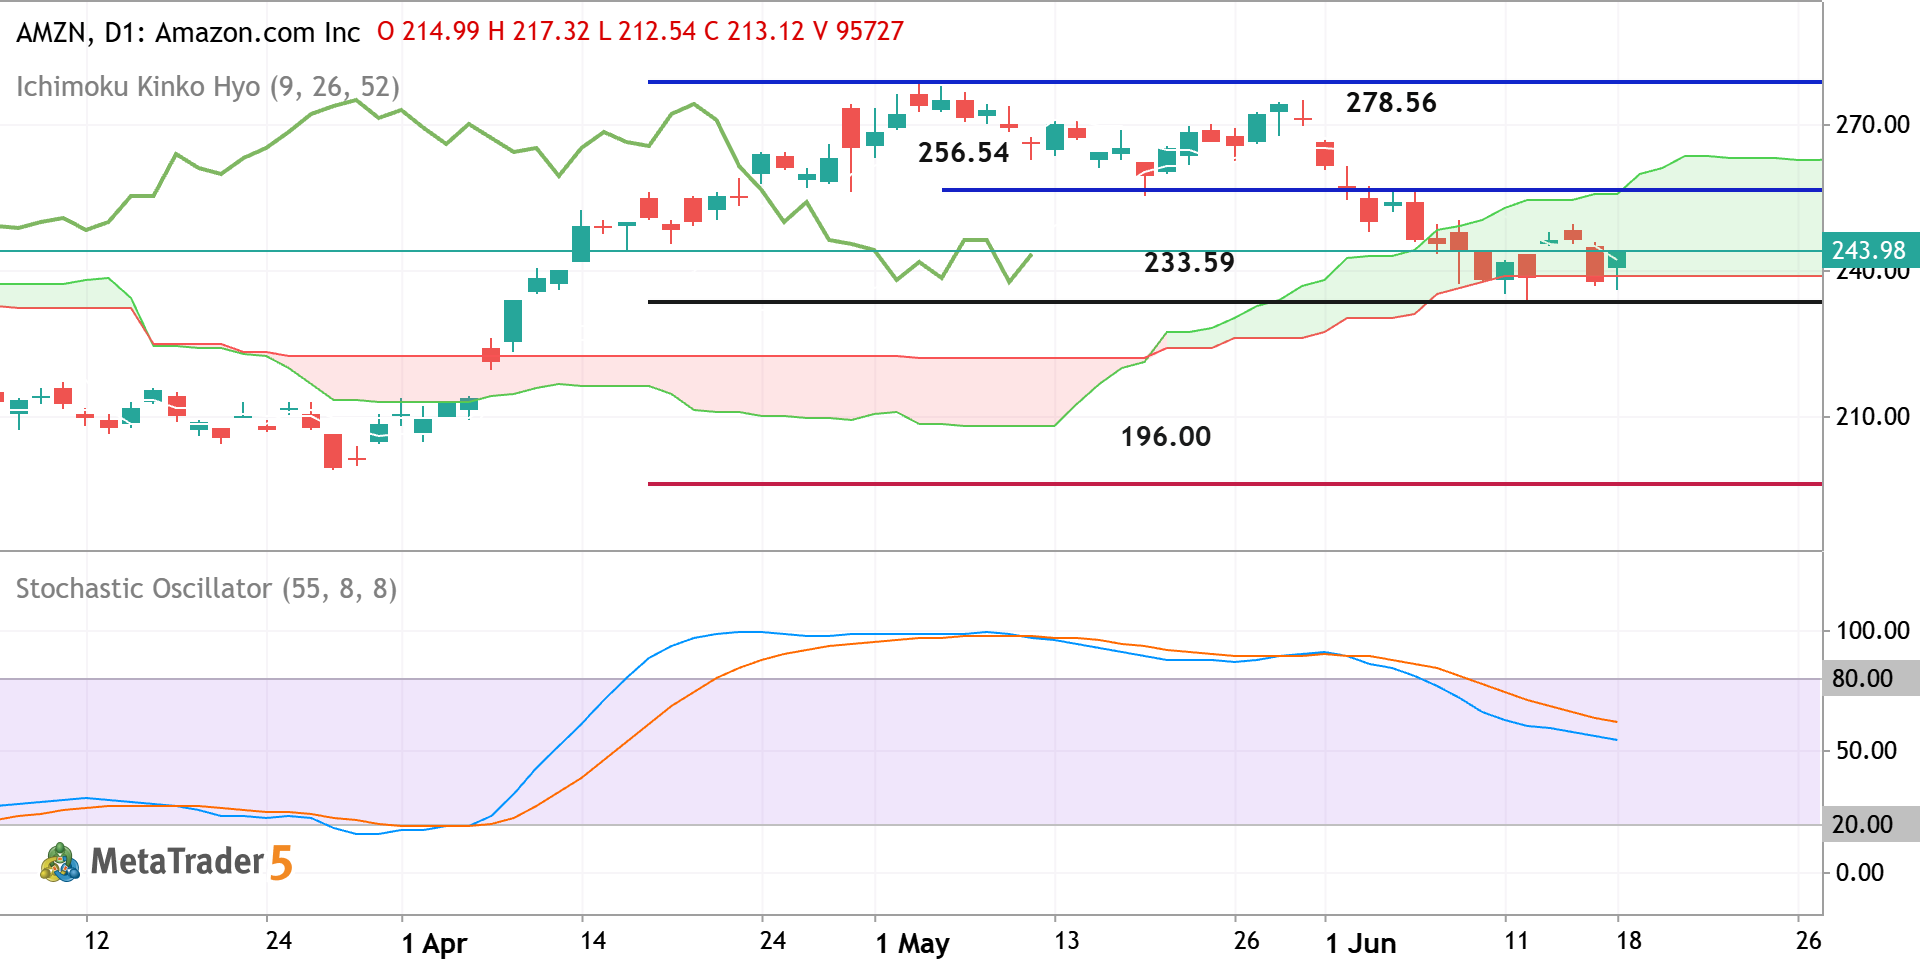

AMZN - Breakdown with the Possible Bearish Reversal
Daily price is located near and inside Ichimoku cloud for trying to break the support level at 233.59 to below for the primary bearish reversal to be started. Chinkou Span line of Ichimoku indicator broke the historical price to below for the strong breakdown to be started for the possible bearish reversal of the daily price movement. If the price crosses the 233.59 support ot below so we may see the primary bearish reversal with 196.00 as a possible target. If the price breaks the resistance at 256.54 to above so the primary bullish trend will be resumed with 278.56 target to re-enter, Alternatively, the price will be on secondary ranging to be inside and near the Ichimoku cloud waiting for direction. Trading Summary : breakdown with the possible bearish reversal
2026.06.18 16:10 1 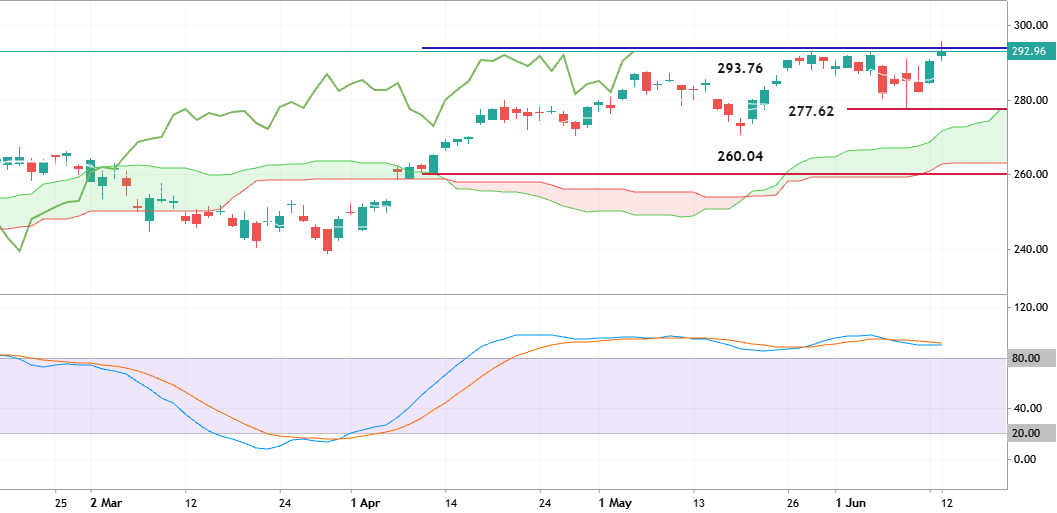

IWM - Daily Trading Forecast
The daily price is located above Ichimoku cloud in the bullish area of the chart. Stochastic oscillator is showing the overbought market condition but the price is still trying to break the resistance level at 293.76 for the goood breakout. If the price breaks the resistance at 293.76 to above on daily close bar so the strong bullish trend will be resumed. If the price crosses 277.62 support to below so the primary bearish reversal may be started with the secoindary ranging way and with 260.04 as a good terget to re-enter. Alternatively, the price will be on ranging within s/r channel waiting for the direction of the strong trend to be started. Trading Summary : ranging; ready for the daily breakout
2026.06.14 14:54 1 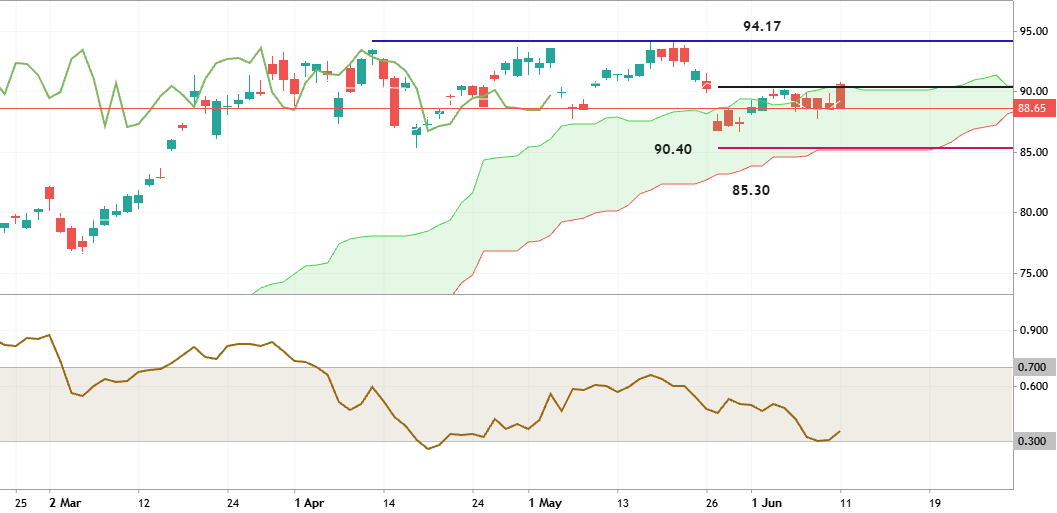

TTE - Daily Trading Forecast
Daily price is located inside Ichimoku cloud for trying to cross the resistance level at 90.40 to above for the bullish trend to be resumed. If the price breaks resistance at 90.40 on the daily close bar so the bullish trend will be resumed with 94.17 resistance as the possible target. If the price crosses the support level at 85.30 so the daily bearish reversal will be started. Alternatively, the price will be on ranging waiting for direction. Trading Summary : ranging waiting for the bullish trend to be resumed.
2026.06.11 17:43 4 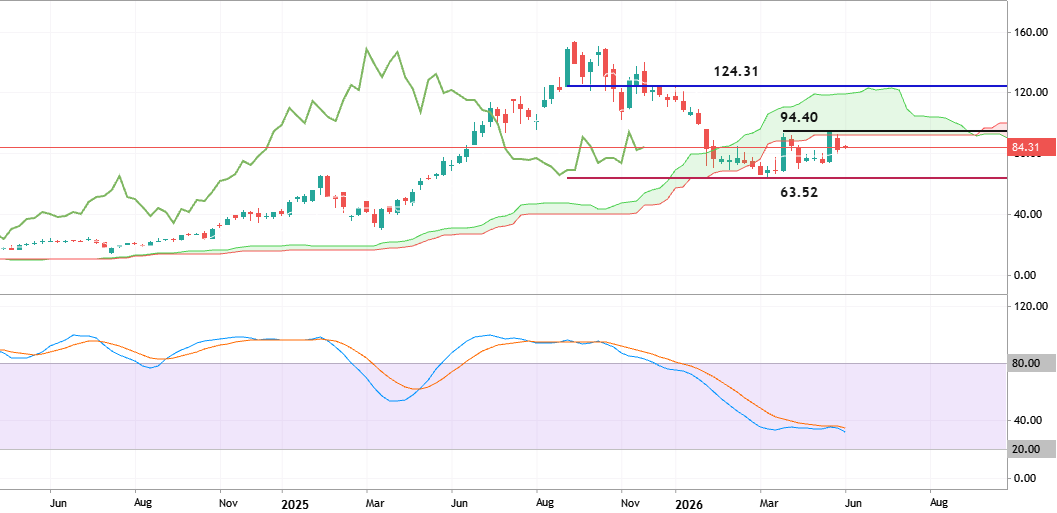

HOOD - Long-Term Technical Forecast
Weekly price is located near and below Ichimoku cloud in the bearish area of the chart. The symmentic pattern was formed with support level at 63.52 and resistance at 94.40. If the price breaks the support level at below on weekly close bar so the bearish trend will be resumed. If the price crosses the resistance level to above so the primary bullish reversal will be started with 124.31 resistance level as a final reversal target to re-enter. Alternatively, the price will be on secondary ranging to be inside s/r channel for direction. Trading Summary : ranging for direction - bearish trend to be resumed or the bullish reversal to be started.
2026.06.08 17:31 1 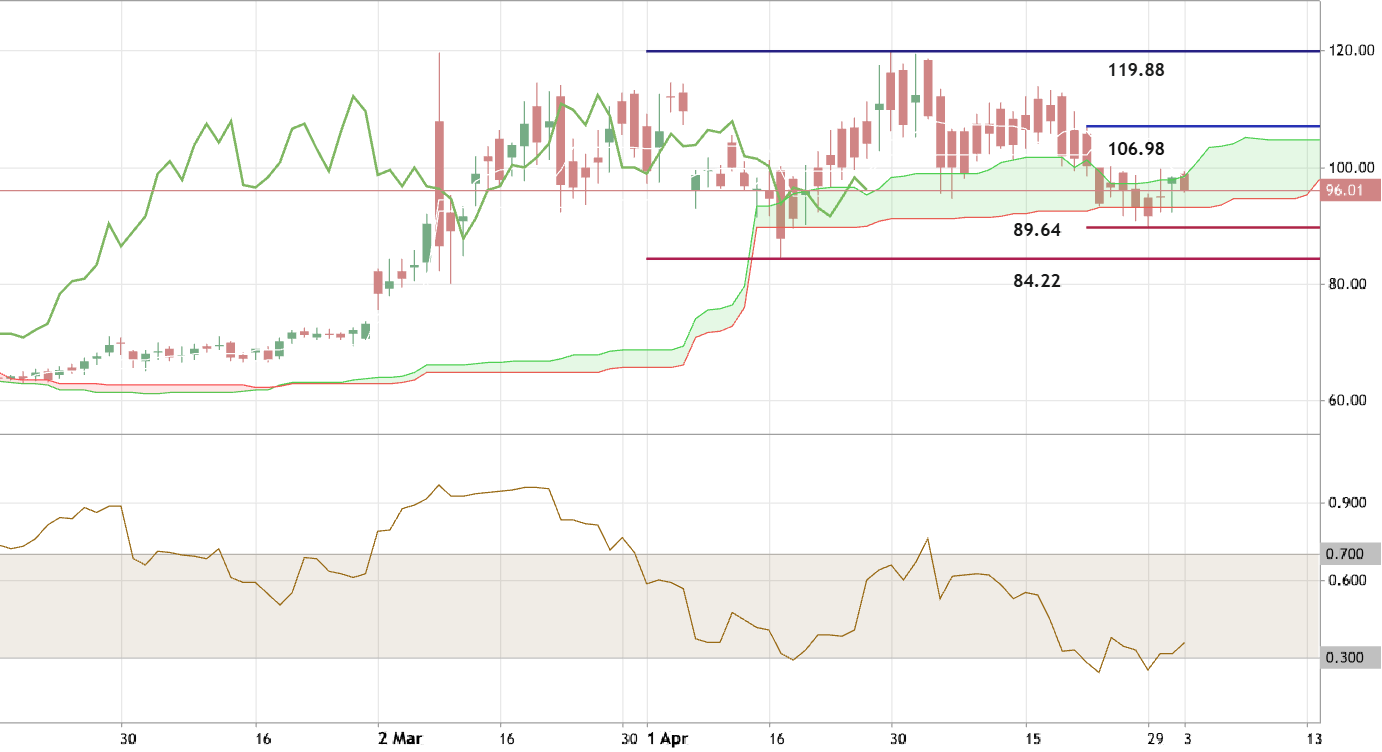
XBRUSD - Daily Trading Forecast
Daily price is on ranging to be inside Ichimoku cloud and in the s/r channel for direction: if the price breaks resistance level at 106.98 to above so the primary bullish trend will be resumed with 119.88 level as a possible target; if the price crosses support level at 89.64 to below so the primary bearish reversal will be started with 84.22 level to re-enter; alternatively, the price will be on secondary ranging waiting for direction. Trading Summary : ranging for direction
2026.06.03 03:19 4 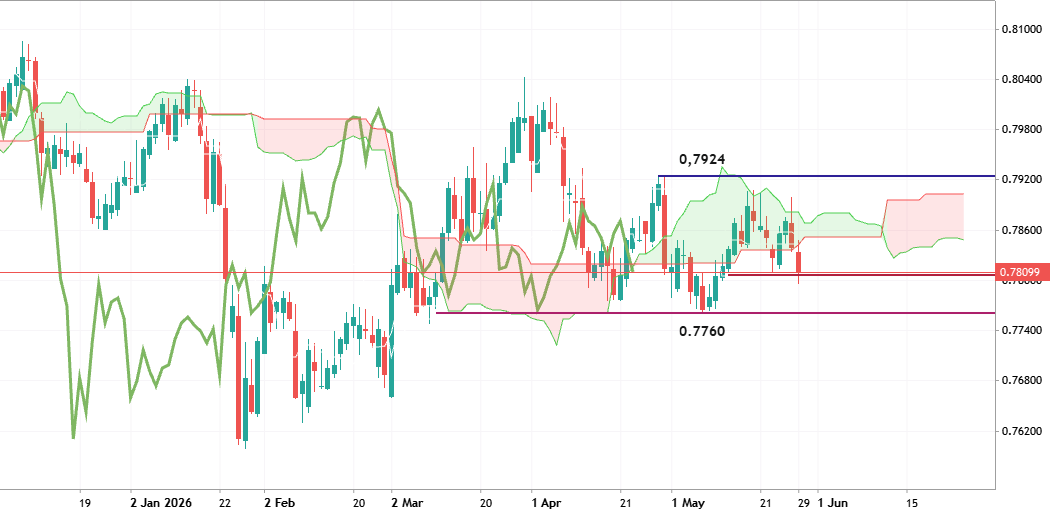
USDCHF - Daily Trading Forecast
Chinkou Span line of Ichimoku indicator is breaking historical price to below together with the daily price which was broke Ichimoku cloud to below as well for the primary bearish reversal. If the price crosses support level at 0.7806 to below on the close daily bar with 0.7760 possible target to re-enter so the bearish trend will be continuing. If the price breaks 0.7924 resistance level to above so the primary bullish reversal will be resumed. Alternatively, the price will be on ranging within s/r channel for direction. Trading Summary : possible bearish trend to be continuing
2026.05.31 08:26 1 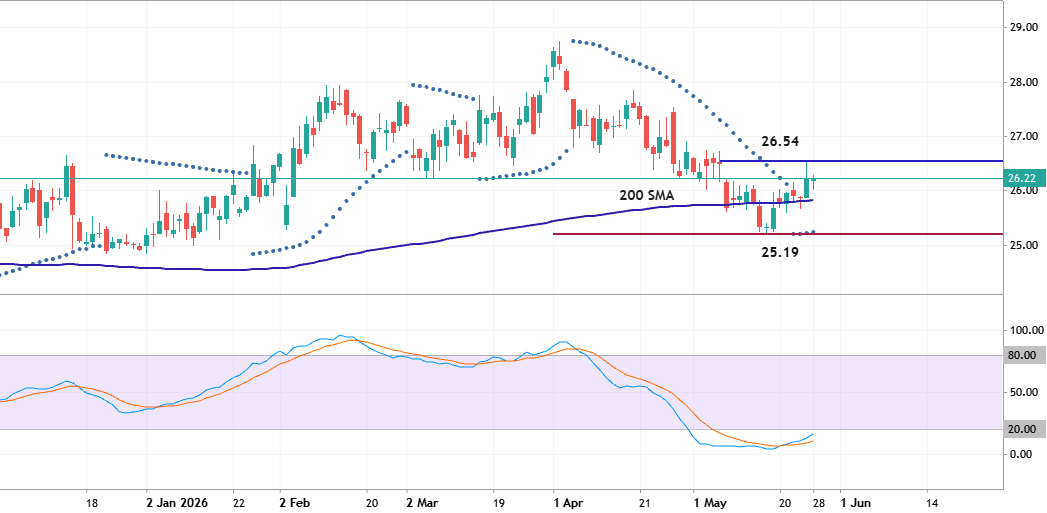

PFE - Daily Trading Forecast
Daily price was bounced from support level at 25.19 to above for 200 SMA to be crossed for the bullish trend to be resumed. Stochastic oscillator is showing the oversold market condition for the price, and Parabolic SAR is on uptrend for the price to be started so the bullish trend continuation is very likely for D1 price for example. if the price breaks 26.54 resistance level to above for the 27.85 possible target so the primary bullish trend will be resumed; If the price crosses support level at 25.19 to below so the bearish reversal will be started with 24.83 as the target to re-enter; alternatively, the price will be on secondary ranging to be near 200 SMA waiting for the direction of the strong trend to be started. Trading Summary : ranging for direction
2026.05.28 16:32 1 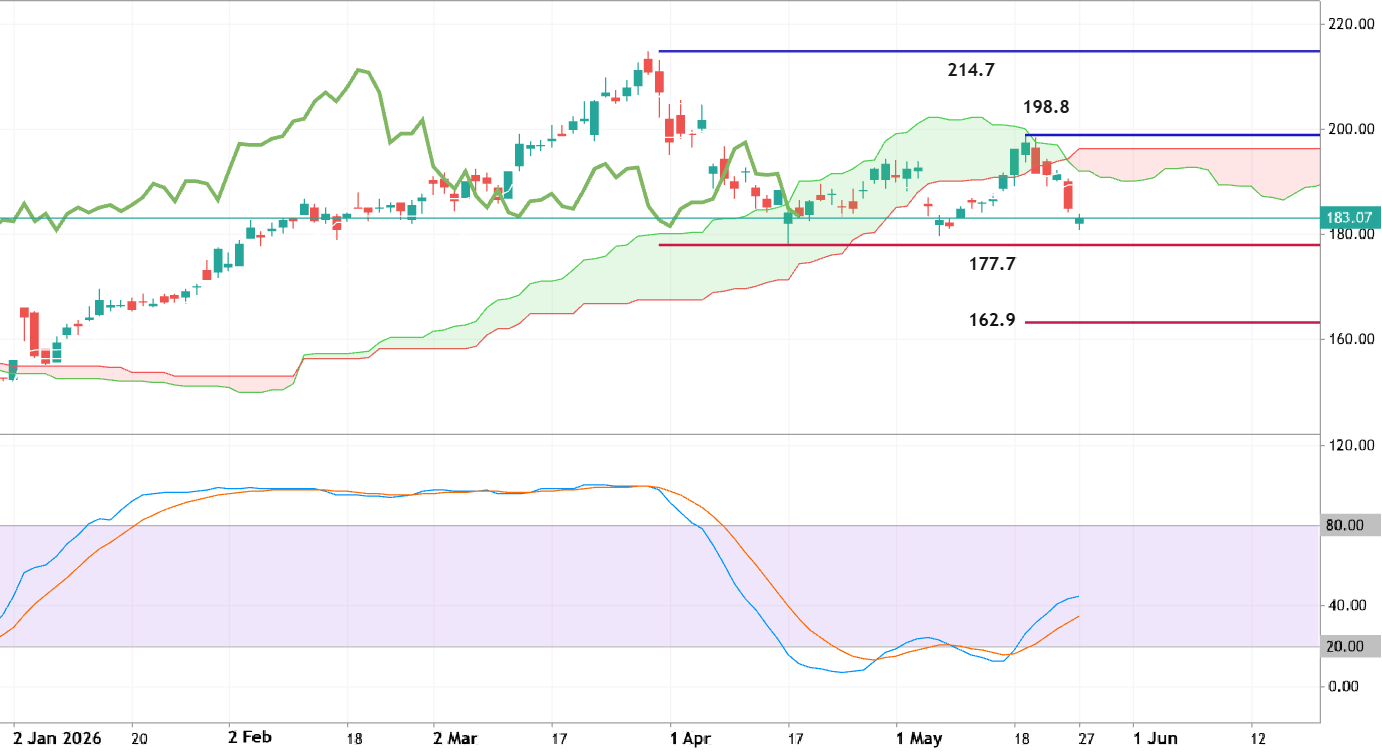

CVX - Daily Trading Forecast
Daily price broke Ichimoku cloud to below for the primary daily bearish reversal. Chinkou Span line of Ichimoku indicator is crossing the historical price to below for the good bearish breakdown but Stochastic oscillator is indicating the possible rally in the near future. If the price breaks support level at 177.7 to below with 162.9 level as a possible target so the bearish trend will be continuing. If the price crosses resistance level at 198.8 to above with 214.7 level as a possible target so the bullish reversal will be started. Alternatively, the price will be on secondary ranging waiting for direction. Trading Summary : daily bearish reversal; watch the s/r levels for the next direction
2026.05.27 17:43 1 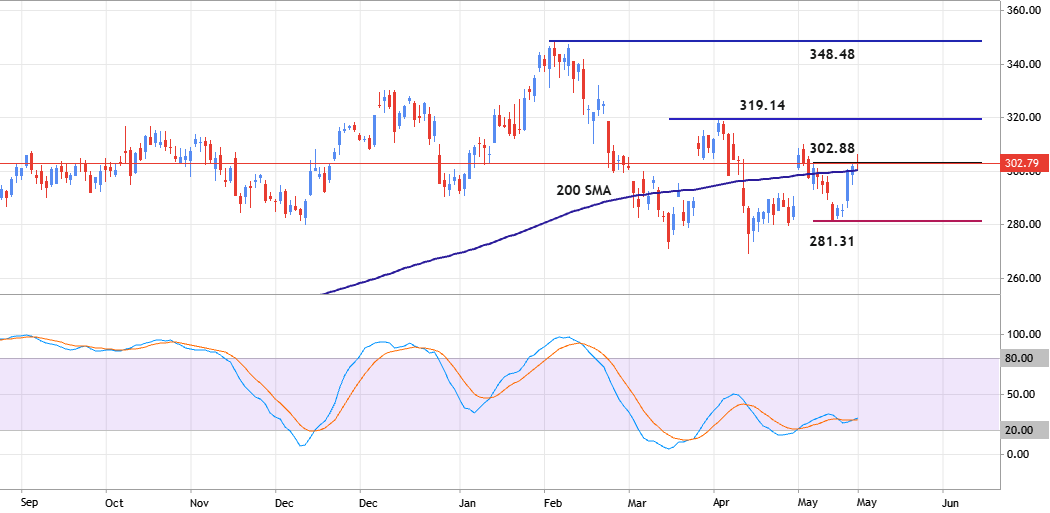

GE - Daily Ranging for Direction
The daily price is on ranging near and above 200 SMA: if the price breaks 302.88 level to above for the daily close bar and with 319.14 target to re-enter so the primary bullish trend will be resumed and continuing; if the price crosses 200 SMA to below together with 281.31 support so the bearish reversal will be started; alternatively, the price will be on the ranging to be near and around 200 SMA waiting for the direction of the trend to be started. Trading Summary : ranging for direction
2026.05.24 15:56 2 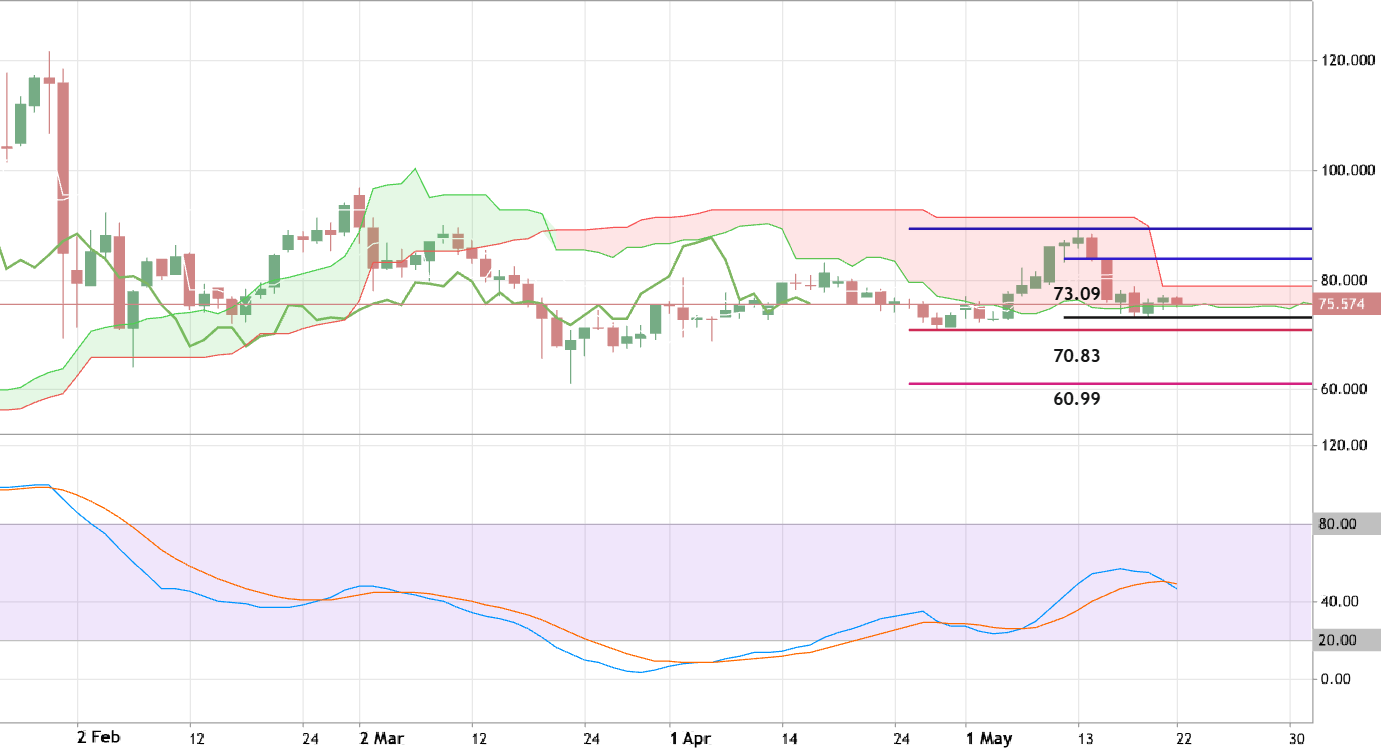
XAGUSD - Daily Ranging for the Possible Bearish Reversal
Daily price is breaking the Ichimoku cloud with Senkou Span A together with support level at 73.09 to below for the bearish reversal to be started. Chinkou Span line already crossed the historical price to below and Stochastic oscillator is showing the downtrend to be started in the near future. If the price breaks 73.09 support to below so the primaru bearish reversal will be started with 70.83 target to re-enter. If the price crosses resistance level at 83.86 to above so the primary bullish trend will be resumed with 89.38 as a possible target. Alternatively, the price will be on secondary ranging to be near and inside Ichimoku cloud waiting for the direction of the strong trend to be started for example. Trading Summary : waiting for direction
2026.05.23 14:44 1 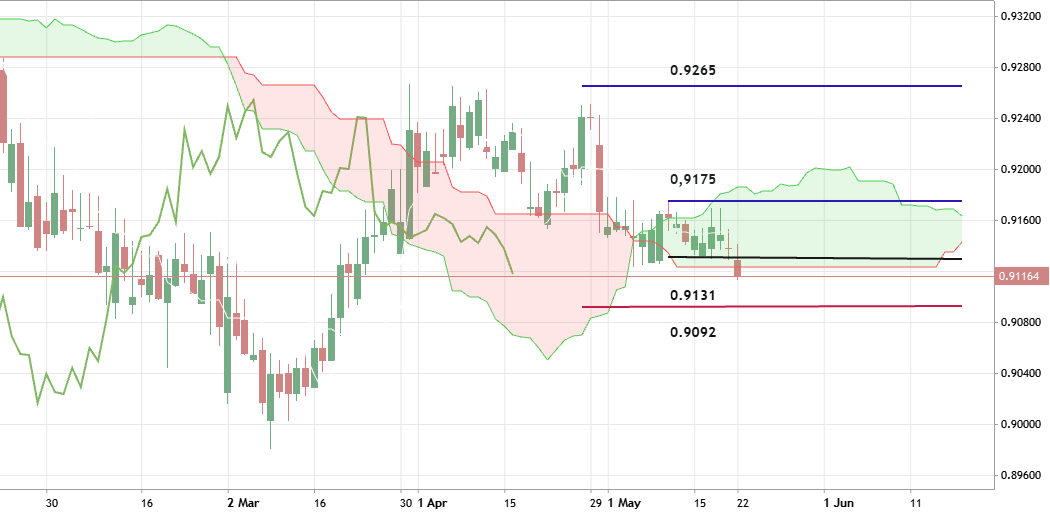
EURCHF - Daily Bearish Reversal
Daily price is breaking the descending triangle pattern with support at 0.9131 together with Ichimoku cloud to below for the good breakdown with the primary bearish reversal to be started. If the price breaks 0.9131 support to below on close daily bar so the primary bearish reversal will be continuing with 0.9092 level as a possible target to re-enter. If the price crosses the resistance level at 0.9175 so the primaru bulish trend will be resumed with the secondary ranging condition and with 0.9265 possible target. Alternatively, the price will be on ranging within s/r levels to be near and inside Ichimoku cloud waiting for the direction of the strong trend to be started. Trading Summary : possible daily bearish reversal
2026.05.22 15:18 2 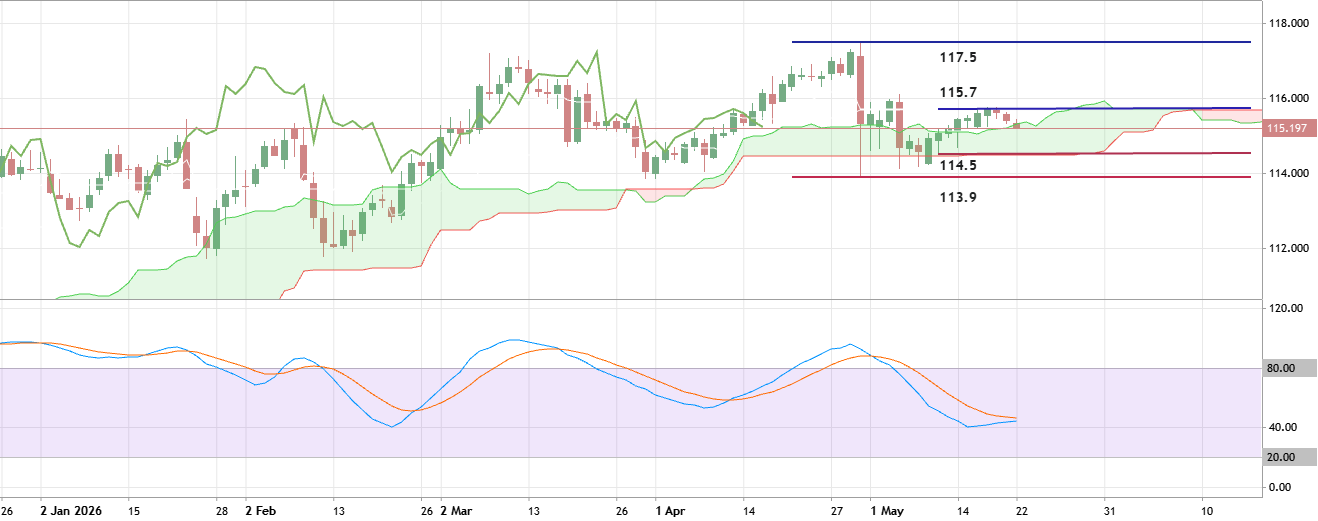
CADJPY - Possible Daily Breakdown with the Bearish Reversal
Daily price is located above and near Ichimoku cloud in the bullish area of the chart. The price was bounced from resistance level at 115.7 to below to cross the Ichimoku cloud border from above. Besides, the Chinkou Span line of Ichimoku indicator is breaking the historical price to below for the good breakdown to be started, and Stochastic oscillator is indicating the downtrend in the near future. If the price breaks support level at 114.5 to below so the primary bearish reversal will be started with 113.9 as a possible target. If the price crosses resistance at 115.7 to above so the primary bullish trend will be resumed with 117.5 possible target. Alternatively, the price will be on secondary ranging within s/r levels waiting for direction. Trading Summary : possible daily breakdown
2026.05.22 14:51 0