USDZAR — Short at Supply Rejection [Quantum Algo] USDZAR US Dollar vs Rand
USDZAR — Short at Supply Rejection [Quantum Algo]
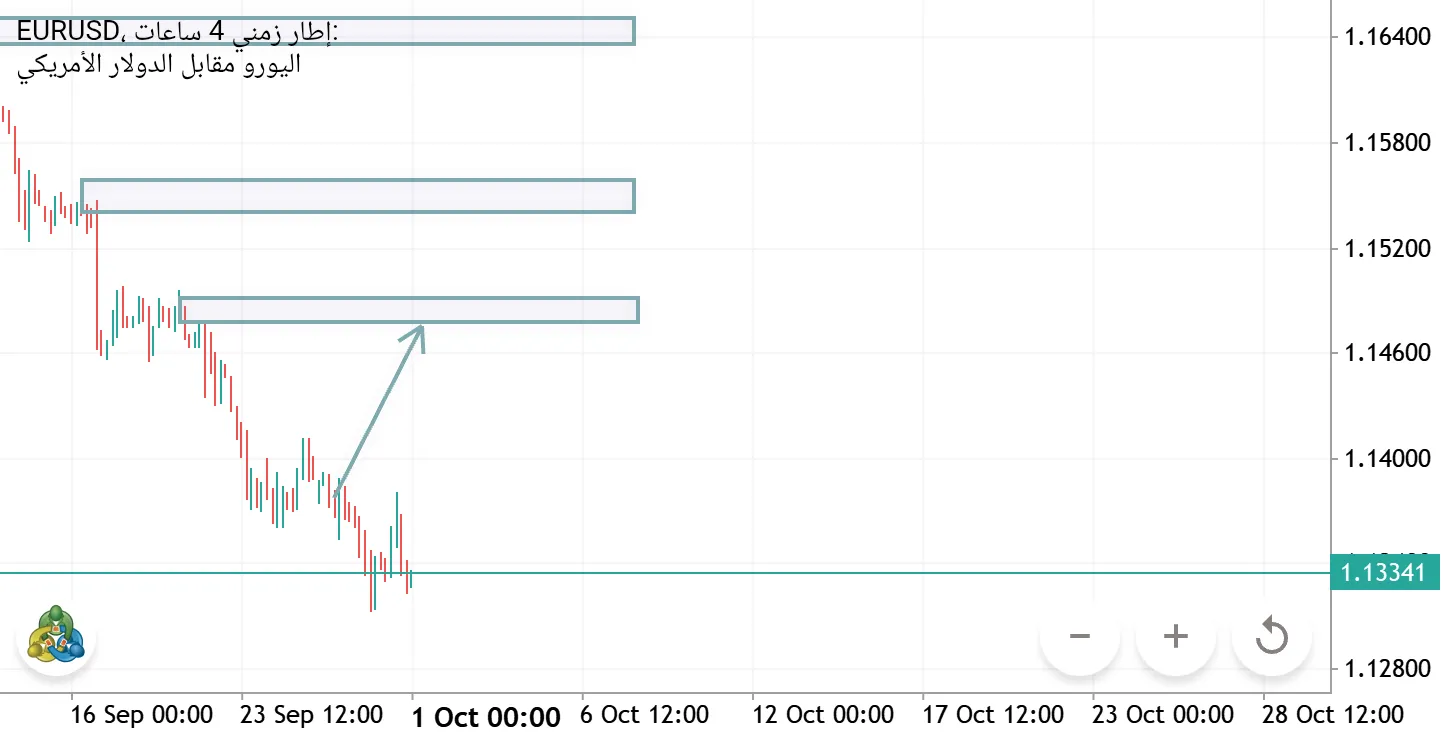
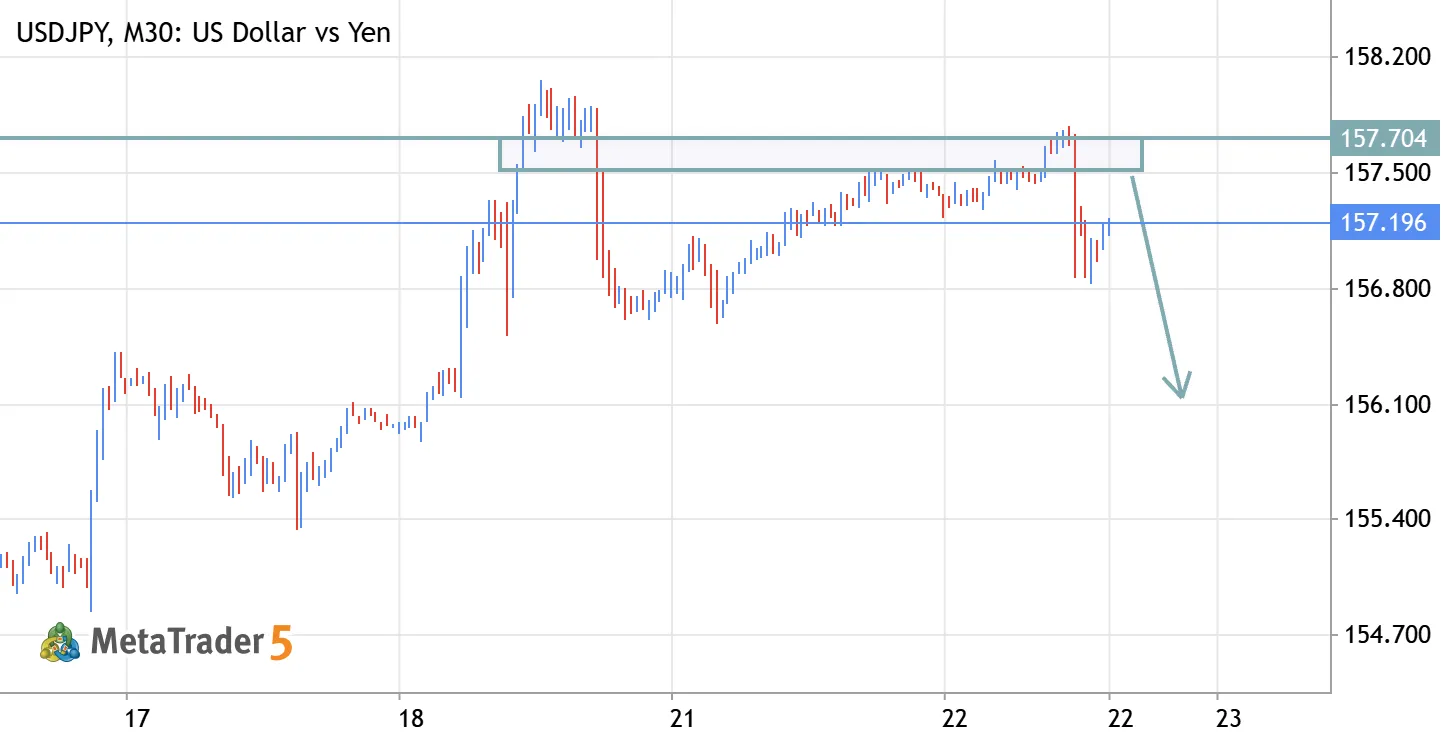
Read the chart, Q — USDZAR 2h, forex. Sell fired at overhead supply around 16.45 after the range bounce failed. Levels eyeballed off the zone and the target box; swap in your exact marks if you've got them. Title: USDZAR — Short at Supply Rejection [Quantum Algo] Context: USDZAR has been rotating in a wide 16.15–16.66 range for weeks. Price rallied off the 16.35 lows, pushed back up into an overhead supply block near 16.45, and stalled. The rejection off that zone fired the Sell. This is a range short: fade the top of the balance, target the mid and the range low where liquidity rests. Why this setup works — three confluences: Supply rejection at range resistance. Price tapped the overhead supply block and failed to break through. This zone has capped rallies before, so it's a level with
0
quantumalgoai Quantum Algo 2026.07.01 19:44
GBPUSD TRADE IDEA GBPUSD Long Pound Sterling vs US Dollar
GBPUSD TRADE IDEA
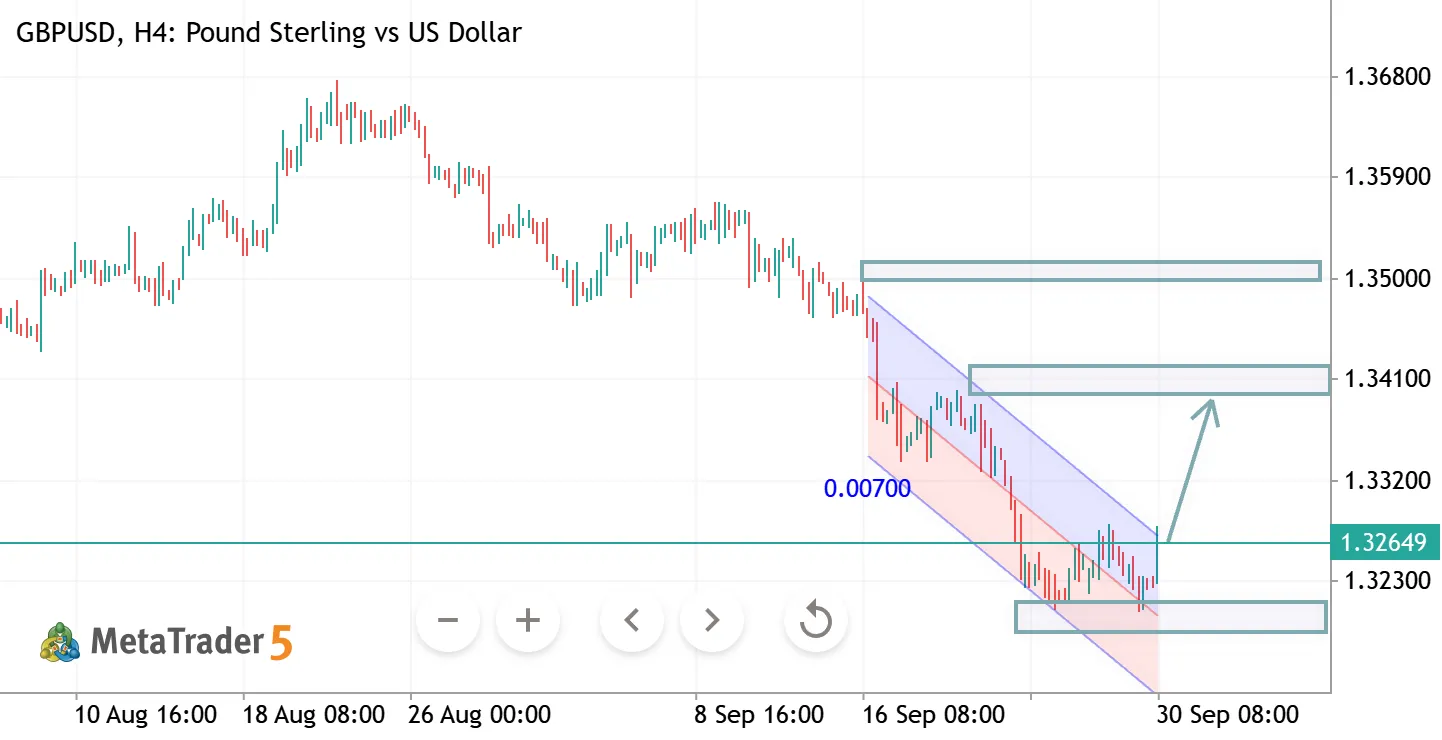
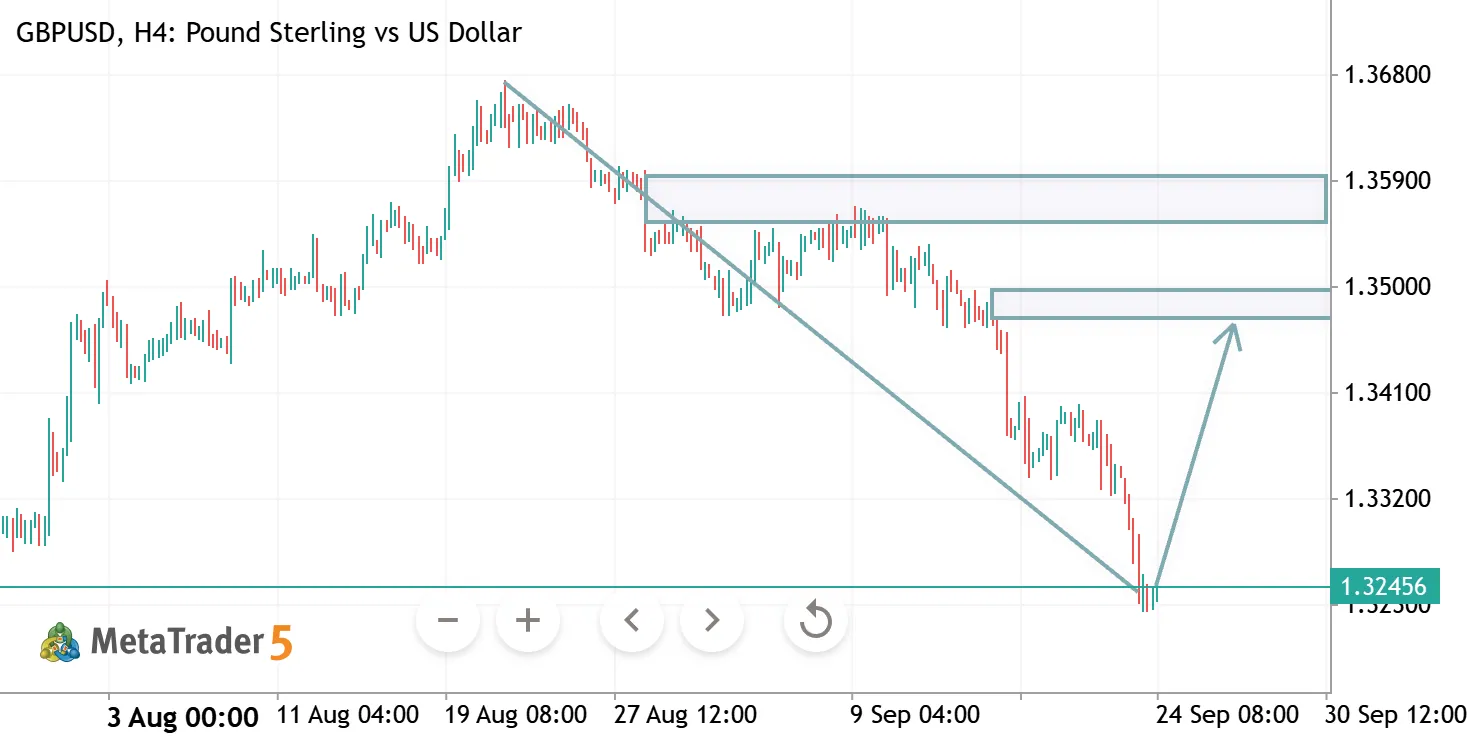
GBPUSD (H1) – Short Trade Setup Based on your chart, a short is reasonable if price rejects the resistance zone around 1.3250–1.3268 . Entry: Sell: 1.3250–1.3265 (after bearish confirmation) Stop Loss: 1.3275–1.3280 (above the recent swing high) Take Profit: TP1: 1.3206 TP2: 1.3160 TP3: 1.3135 (if bearish momentum accelerates) Trade Reason Price is testing a key resistance/supply zone . The overall trend remains bearish despite the recent recovery. A rejection from resistance offers a favorable risk-to-reward setup. Bias: Bearish (Short) , but wait for a bearish rejection candle or a break below the most recent H1 higher low before entering.
1
HamadJatoi Hamad Jatoi 2026.07.01 11:54
EURUSD TRADE IDEA EURUSD Long Euro vs US Dollar
EURUSD TRADE IDEA
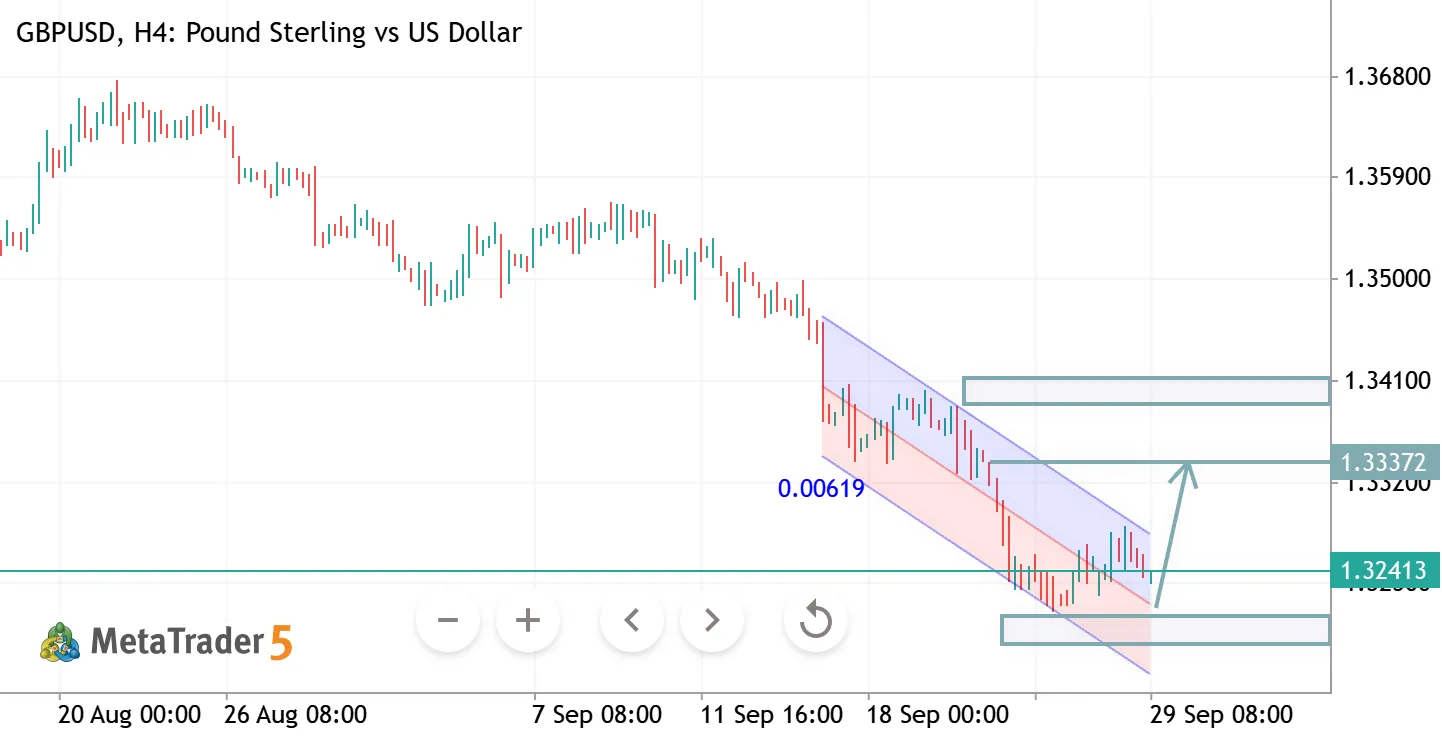
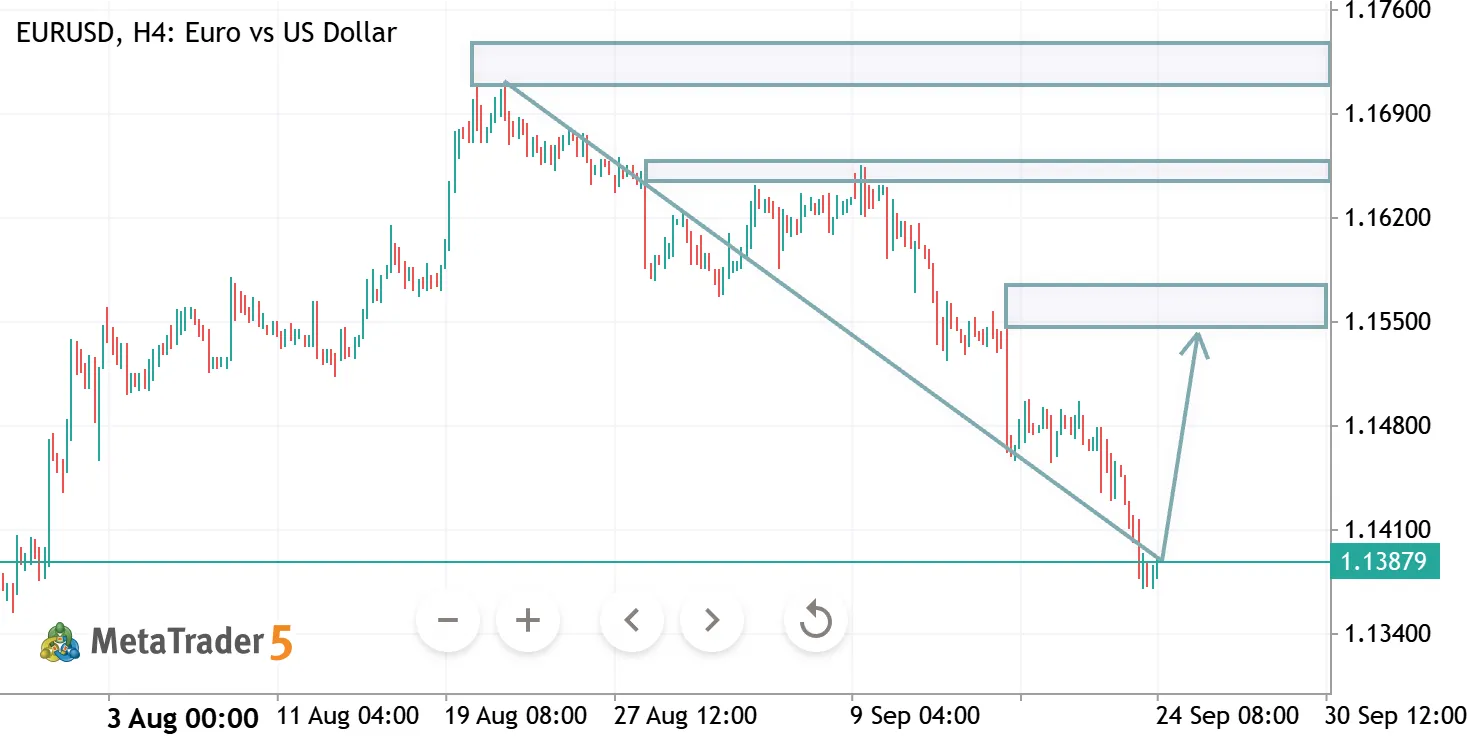
EURUSD – H1 Trade Analysis Based on the chart, EURUSD is showing a bullish bias after respecting an ascending trendline and holding above key support. Market Structure Trend: Short-term bullish. Price has formed higher lows , supported by the rising trendline. Buyers defended the 1.1403–1.1405 support zone multiple times. Key Levels Support: 1.1403 Immediate Resistance: 1.1410 Major Resistance / Target: 1.1432 Trade Idea (Buy) Entry: 1.1404–1.1410 (after a bullish rejection or candle close above resistance) Stop Loss: Below 1.1398 (or below the ascending trendline) Take Profit 1: 1.1423 Take Profit 2: 1.1432 Invalidation If price closes below 1.1403 and breaks the ascending trendline with strong bearish momentum, the bullish setup is invalidated and a move toward 1.1382 becomes more
0
HamadJatoi Hamad Jatoi 2026.07.01 05:38
USDIND - Daily Ranging for Direction USDINR US Dollar vs Indian Rupee
USDIND - Daily Ranging for Direction
Daily price broke the upper border of Ichimoku cloud to below for the secondary ranging market condition. Chinkou Span line of Ichimoku indicator crossed the historycal price to below as well for the good daily breakdown to be started. Stochastic oscillator is showing the bearish condition to be continuing for example. If the price breaks support level at 92.862 to below so the primary bearish reversal will be started. If the price crosses the resistance level at 96.182 to above so the primary bullish trend will be resumed. Alternatively, the price will be on secondary ranging to be near and inside Ichimoku cloud waiting for direction. Recommendation : Waiting for Direction.
3
newdigital Sergey Golubev 2026.06.28 15:00
GBPUSD H1 ANALYSIS GBPUSD Pound Sterling vs US Dollar
GBPUSD H1 ANALYSIS
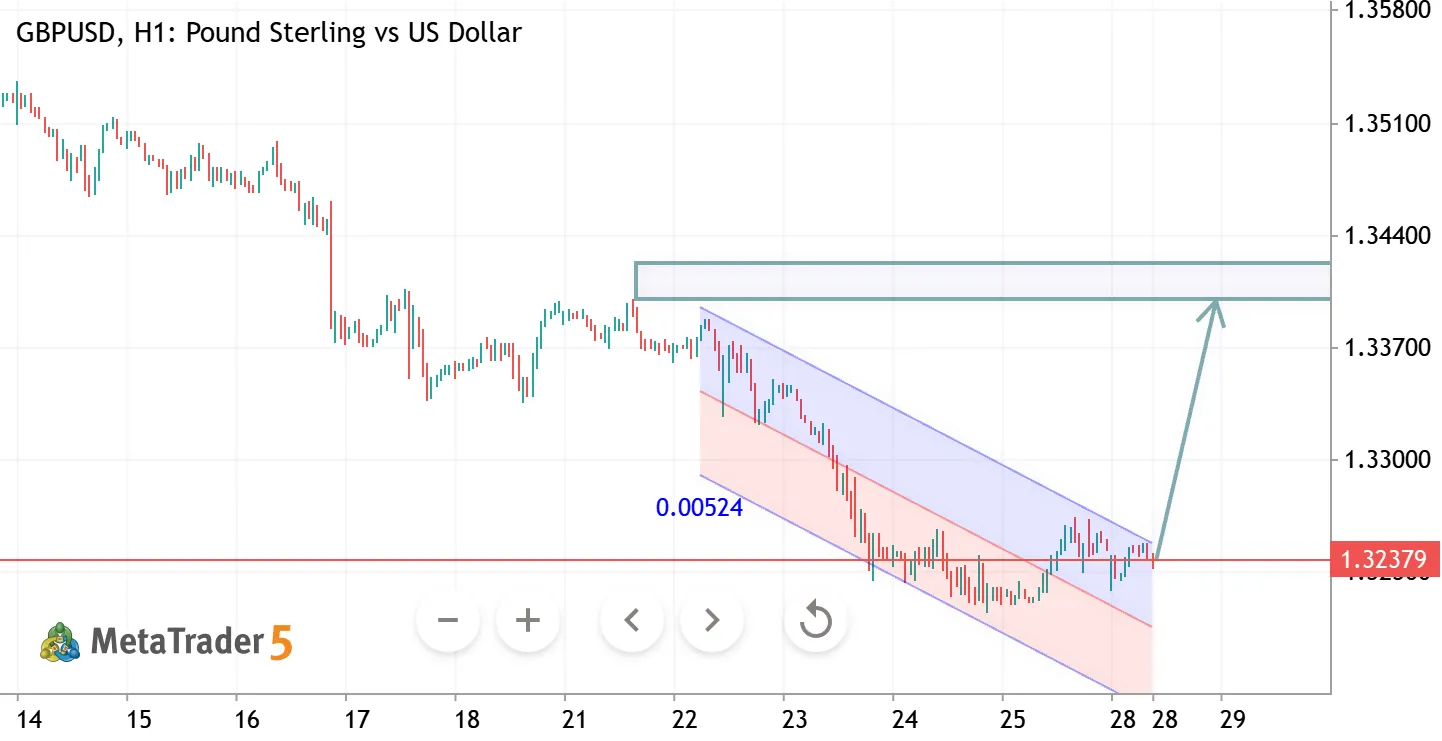
GBPUSD H1 Analysis GBPUSD is holding above a key support zone after completing a pullback within a bullish structure. Price is showing signs of recovery, and a break above the recent consolidation could open the way toward the 1.3250–1.3300 resistance area. Bias: Bullish Key Support: 1.3190 – 1.3170 Key Resistance: 1.3250 – 1.3300 Momentum favors buyers while support remains intact. Trade with proper risk management and confirmation.
0
Goldanalysisteam Abdul Qayoom 2026.06.23 08:42
📊 EURUSD MACRO BIAS BREAKDOWN 📊 EURUSD Short Euro vs US Dollar
📊 EURUSD MACRO BIAS BREAKDOWN 📊
📊 EURUSD MACRO BIAS BREAKDOWN 📊 The fundamental valuation model for EURUSD has updated based on the latest central bank settings and economic data. Here is the structural look at what is driving the pair right now: 📈 Macro Bias Score: -12.11 (Scale -100 to +100) 🎯 Base Currency Strength: Quote currency stronger (USD advantage) 🚦 Final Signal: NEUTRAL / WAIT (Use as directional bias, not an immediate blind entry) 🔍 The Core Pillars: Interest Rate Differential (-4.11 Weighted): The Fed’s higher yields (3.62% vs 2.25%) heavily weigh against the Euro, making the USD structurally more attractive for carry. Central Bank Bias (-10.0 Weighted): A major driver. The ECB remains Neutral with no aggressive moves priced, while the Fed leans Hawkish (25 to 75bps hikes priced) due to sticky US
0
rigan Md Lokman Hossain Mazumder 2026.06.22 18:44
RVI - traditional general approach USDKRW US Dollar vs South korean won
RVI - traditional general approach
Relative Vigor Index (RVI) measures the strength of a price trend by comparing a currency pair's closing price. It operates on the core logic that, in bullish markets, prices tend to close higher than they open, while in bearish markets, they close lower. RVI displays two lines: green line (which is the main RVI oscillator line) and red line (the signal line). Buy Signal: the green RVI line crosses above the red signal line. Sell Signal: the green RVI line crosses below the red signal line. Those crossover signals are more reliable in the direction of the main primary trend - primary bullish and primary bearish, for example - above/below or on the direction of 100 SMA.
0
newdigital Sergey Golubev 2026.06.22 17:30
USD/JPY — Fed Hawkishness + Carry + Retail Divergence USDJPY Long US Dollar vs Yen
USD/JPY — Fed Hawkishness + Carry + Retail Divergence
USD/JPY at 161.74 testing levels above the 160.00 intervention threshold as Fed Chairman Warsh signals a tighter policy path. Despite BoJ verbal warnings, the +275bp OIS carry advantage (SOFR 3.63% vs TONA 0.98%) sustains the bid. Retail sentiment is 85% short, diverging from the institutional carry-driven trend; this extreme retail shorting increases the risk of a squeeze higher toward 163.00 unless the BoJ intervenes. JPY COT LF net short -115,036 reflects crowded carry positioning. USD/JPY: 161.74, OIS Carry: +275bp, Retail: 85% Short
0
SantiagoPla Santiago Nicolas Pla Casuriaga 2026.06.22 13:52
EUR/USD — Volatility Premium + Positioning Stall EURUSD Short Euro vs US Dollar
EUR/USD — Volatility Premium + Positioning Stall
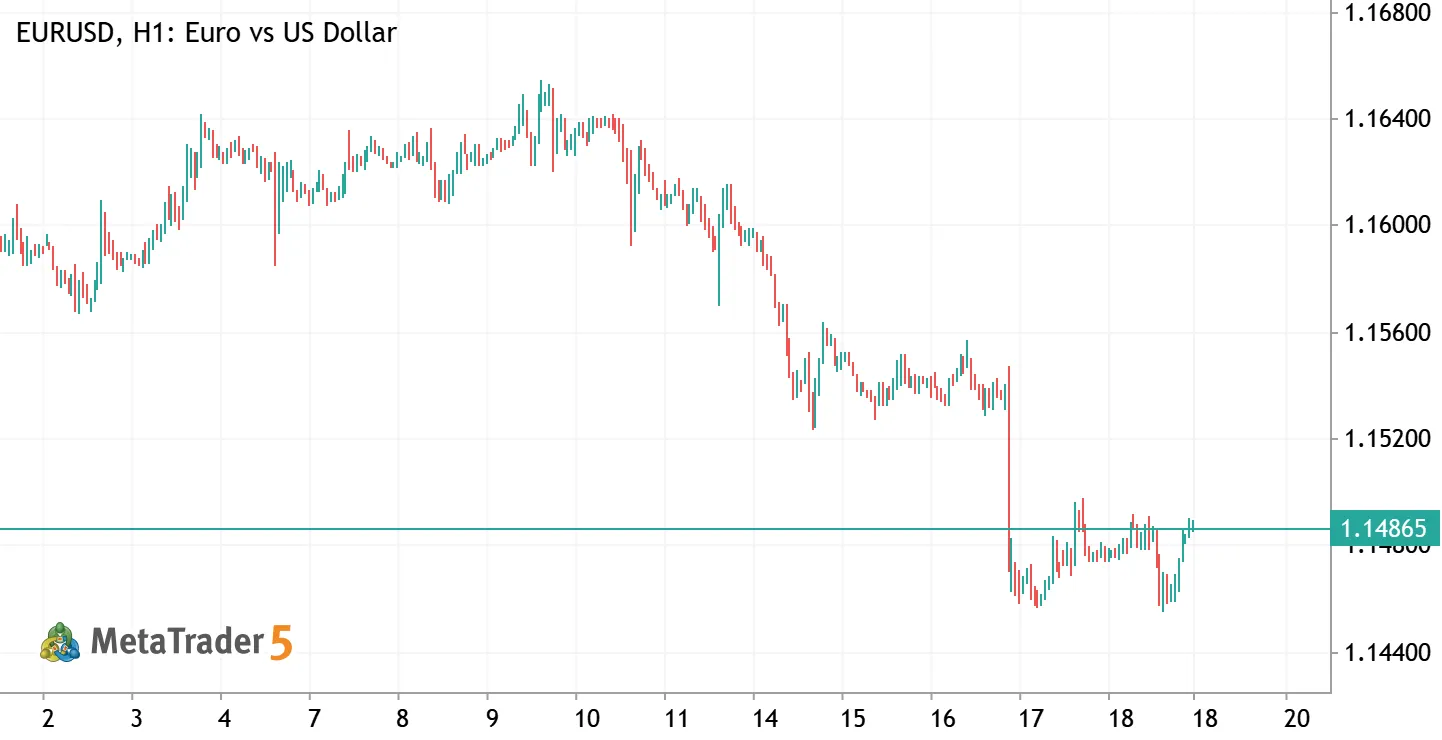
EUR/USD at 1.1464 exhibits an elevated vol risk premium (VRP) of +2.3%, with IV at 7.1% vs HV30 at 4.8%. This suggests the options market is pricing in significant protection relative to recent realized movement. COT LF net short -49,290 aligns with the +150bp USD carry advantage. The negative 25d RR (-0.67) confirms a persistent put skew, indicating that despite the 1W flat performance, the market remains biased toward EUR downside protection. EUR/USD VRP: +2.3%, COT EUR LF Net: -49,290, 25d RR: -0.67
0
SantiagoPla Santiago Nicolas Pla Casuriaga 2026.06.22 13:48