GBPUSD TRADE IDEA
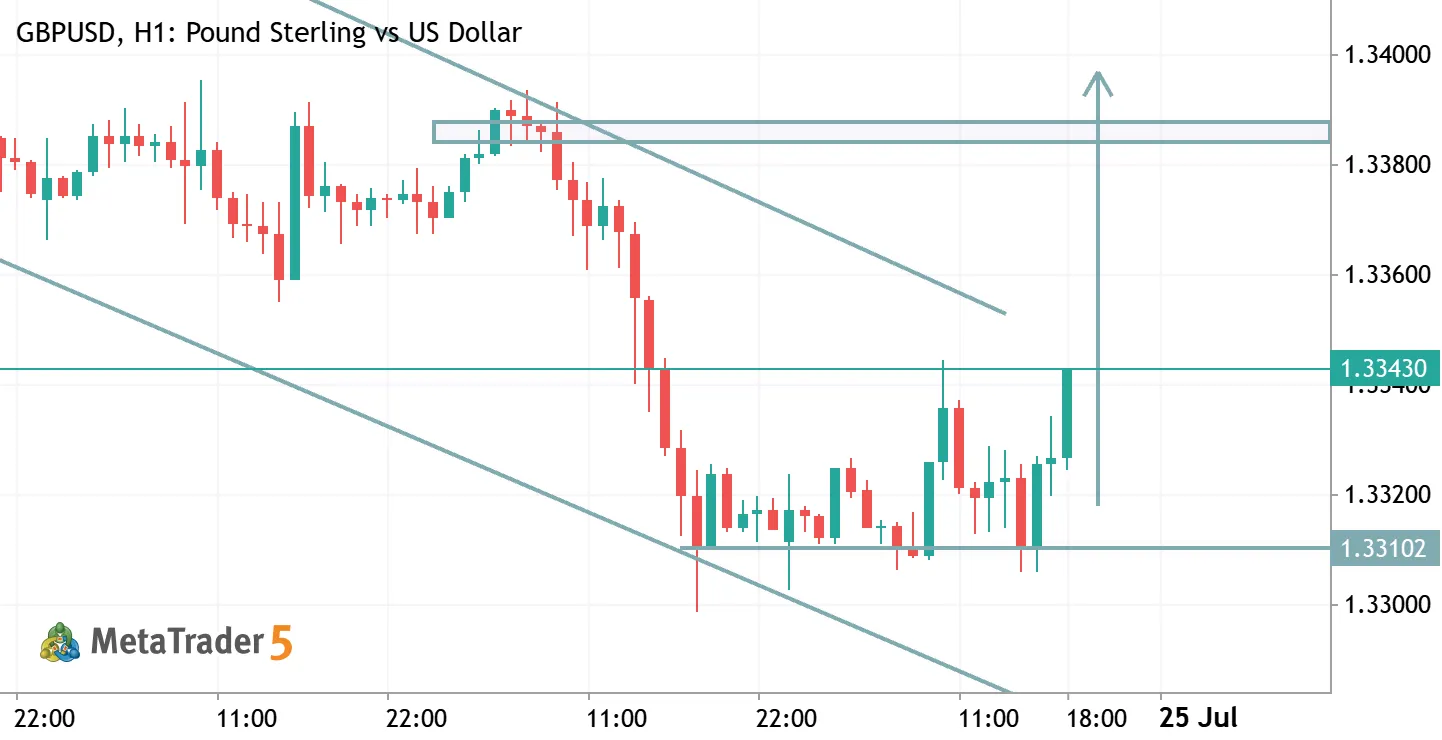
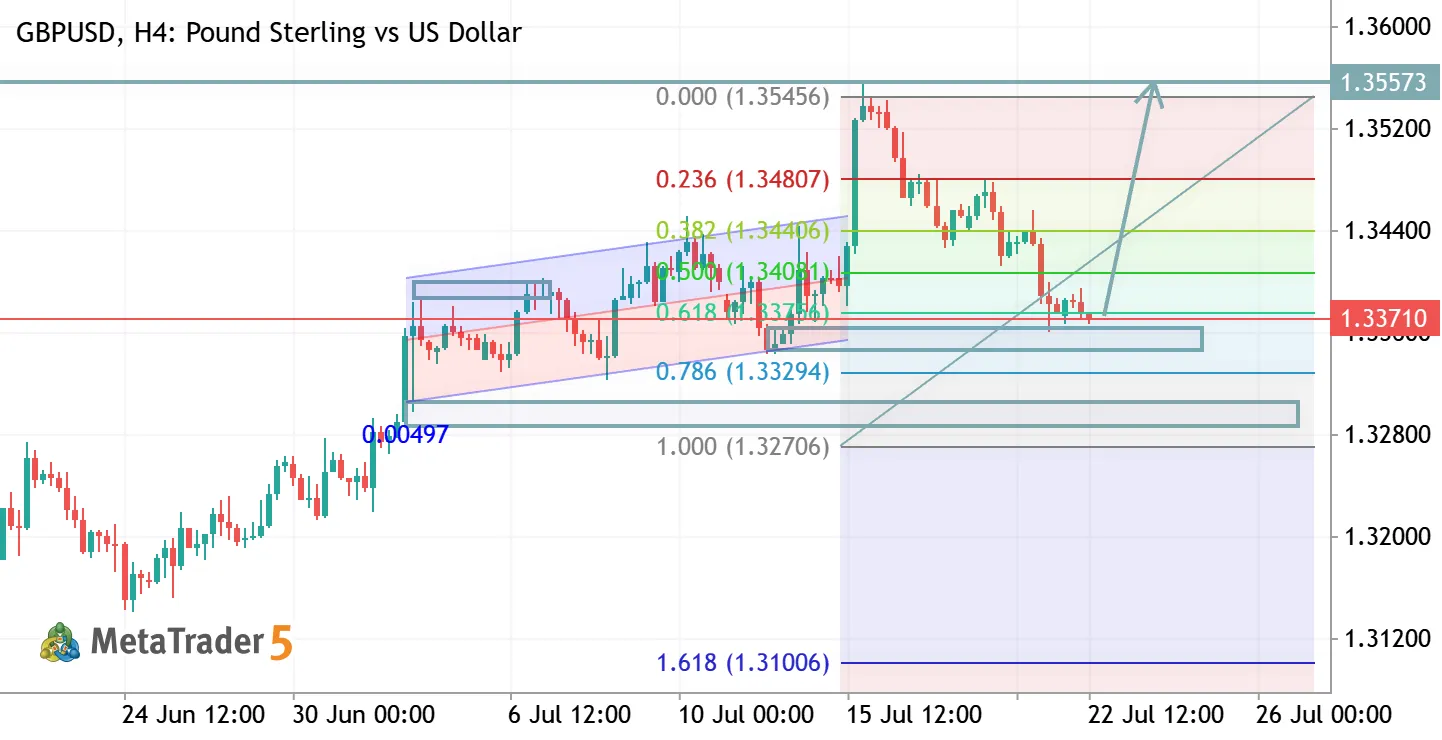
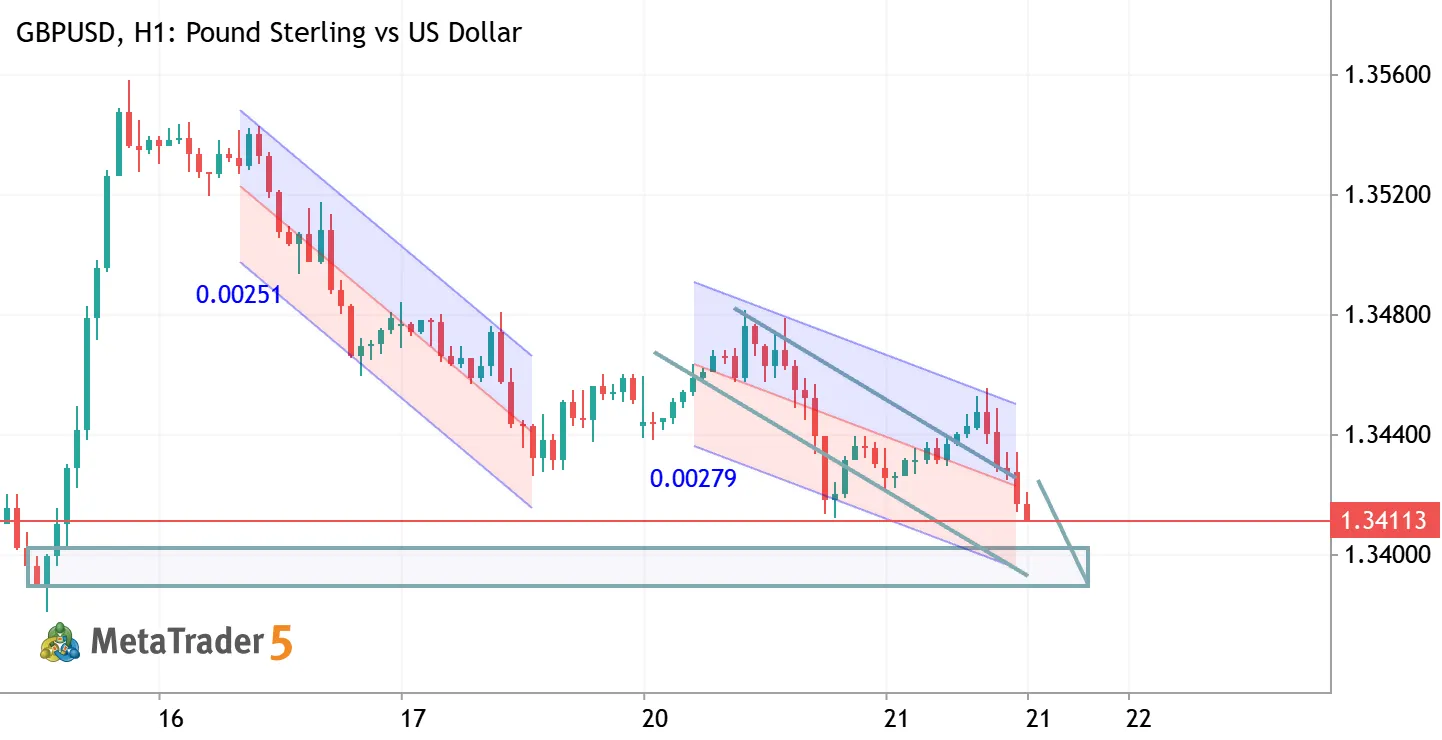
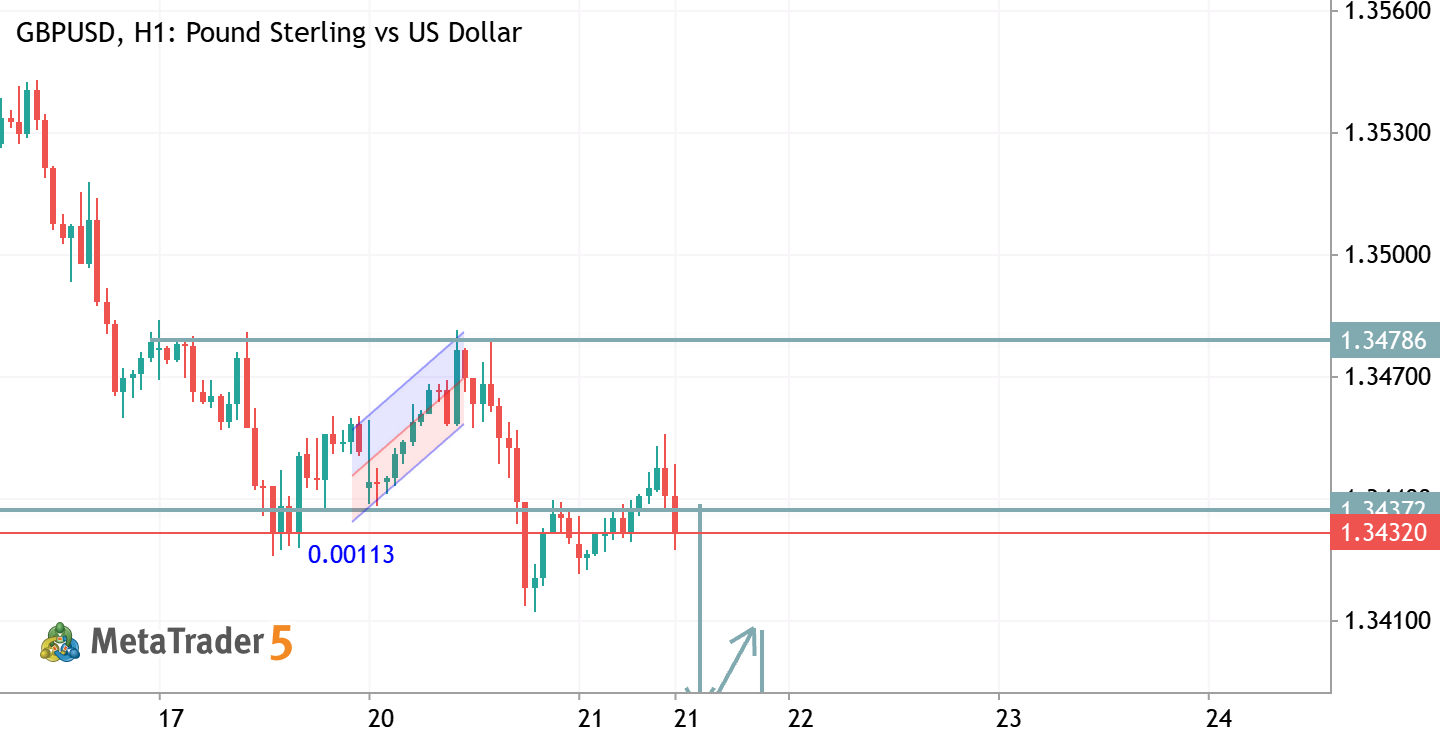
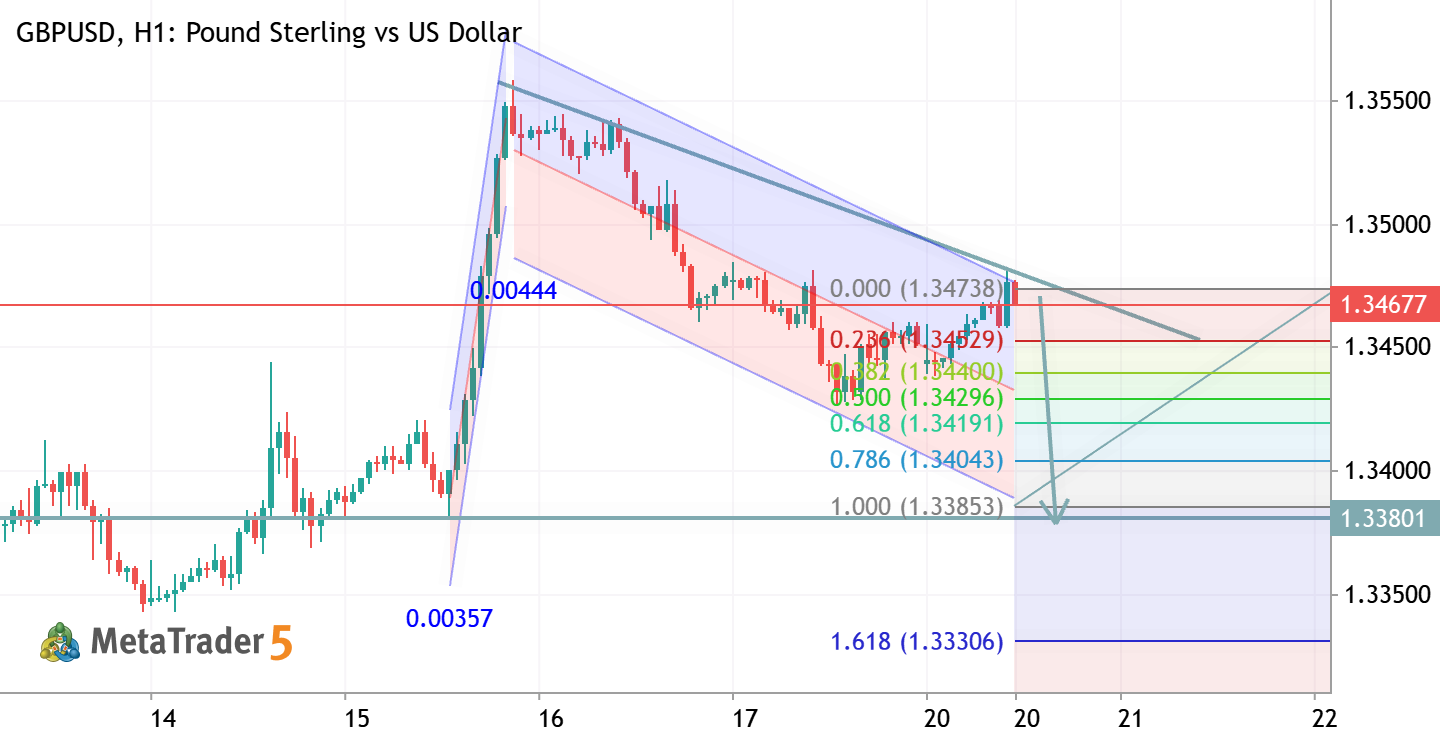
GBPUSD (H1) Bias: Short-term Bullish Rebound Entry Zone: 1.3305 – 1.3315 Stop Loss: 1.3290 Take Profit 1: 1.3340 Take Profit 2: 1.3365 Take Profit 3: 1.3375 Analysis:
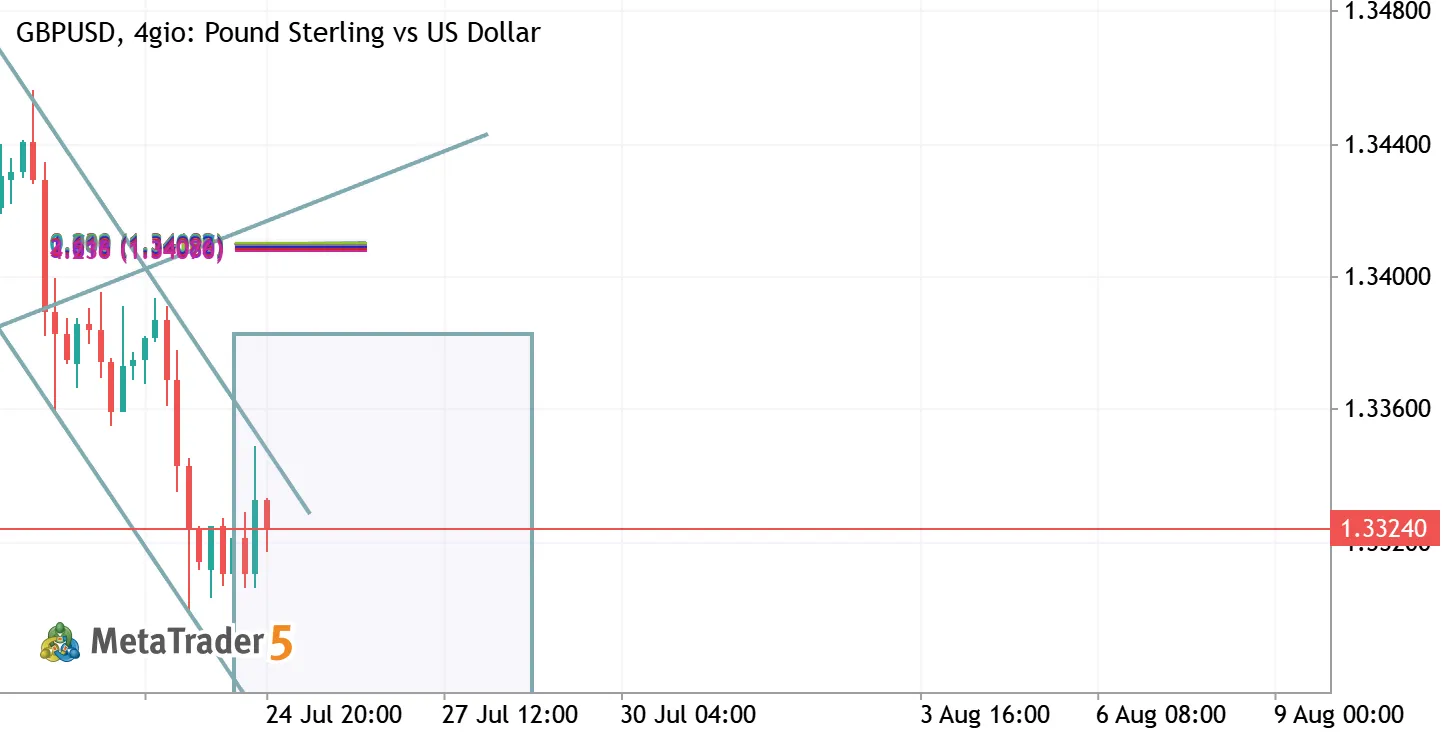
Price is reacting from a strong support area around 1.3300–1.3310 . If buyers defend this level and price holds above support, a corrective move toward the 1.3365–1.3375 resistance zone is possible. The bullish setup is invalidated if H1 closes below 1.3300 .
0