GBPUSD TRADE IDEA GBPUSD Long Pound Sterling vs US Dollar
GBPUSD TRADE IDEA
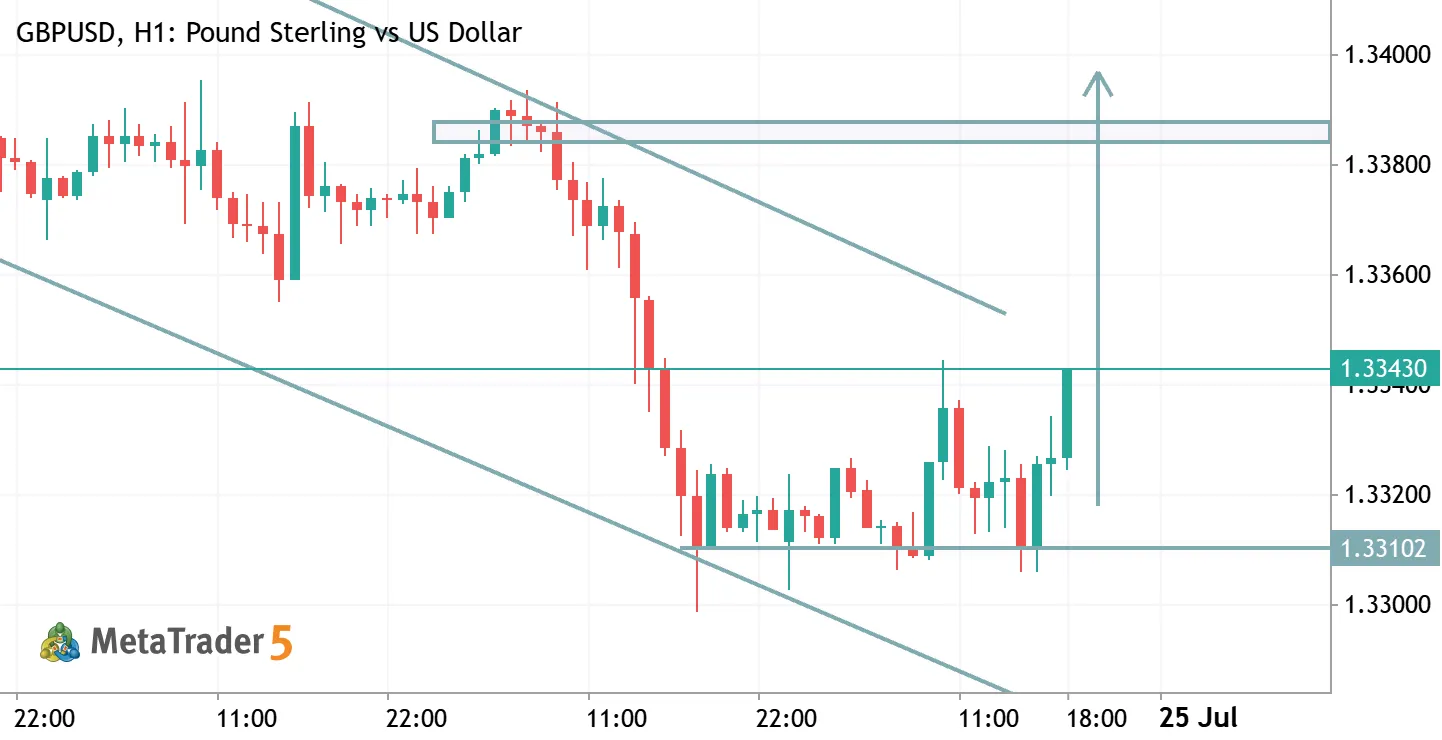
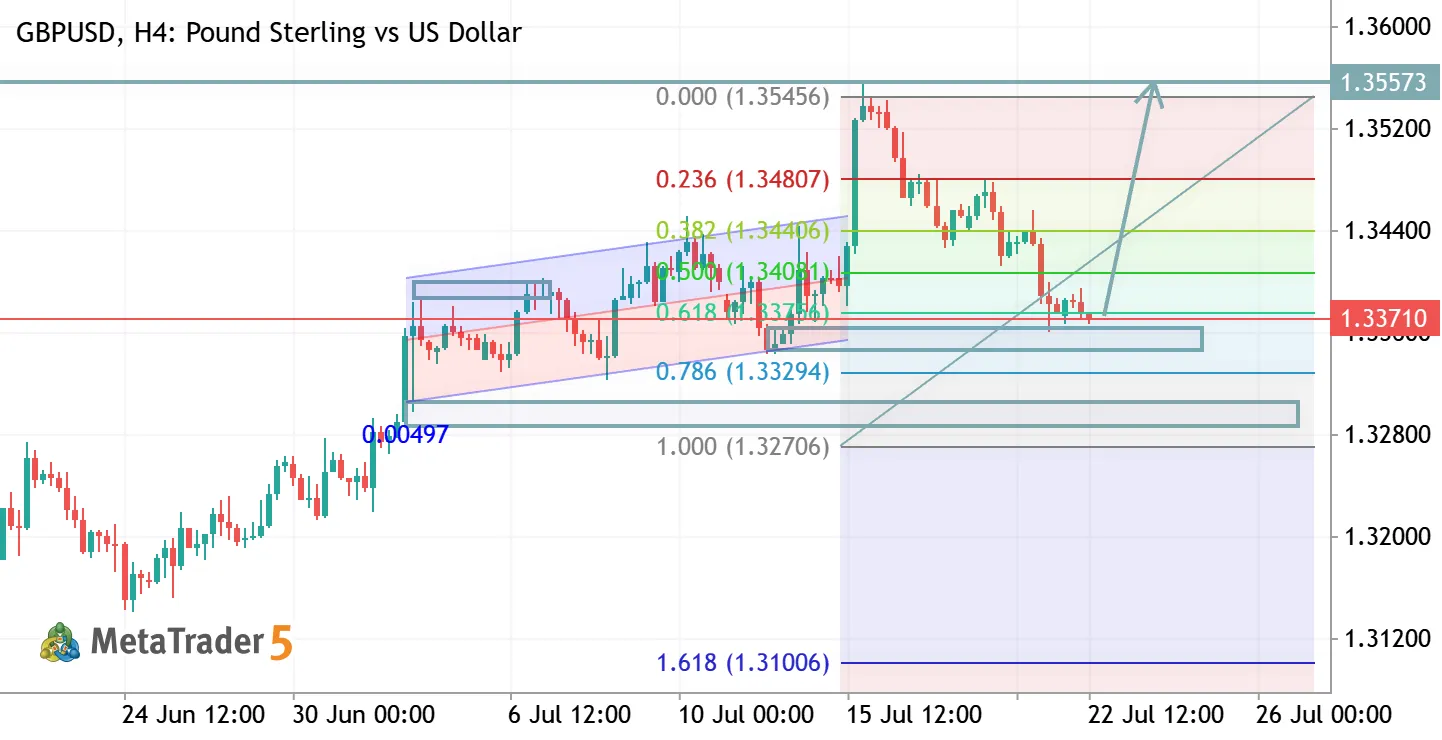
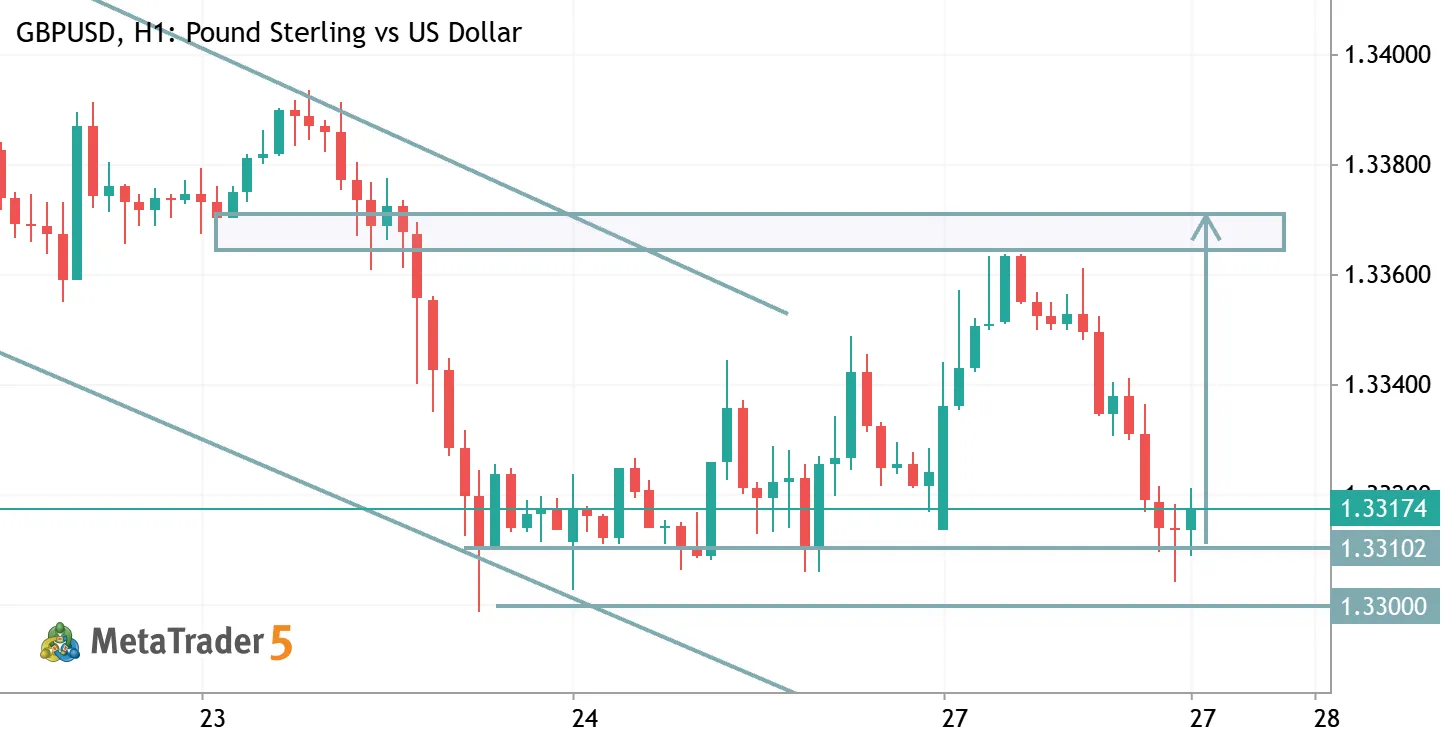
GBPUSD (H1) Bias: Short-term Bullish Rebound Entry Zone: 1.3305 – 1.3315 Stop Loss: 1.3290 Take Profit 1: 1.3340 Take Profit 2: 1.3365 Take Profit 3: 1.3375 Analysis: Price is reacting from a strong support area around 1.3300–1.3310 . If buyers defend this level and price holds above support, a corrective move toward the 1.3365–1.3375 resistance zone is possible. The bullish setup is invalidated if H1 closes below 1.3300 .
0

HamadJatoi Hamad Jatoi 2026.07.27 13:44
Simple Trading Setup with Two Simple Moving Averages GBPUSD Pound Sterling vs US Dollar
Simple Trading Setup with Two Simple Moving Averages
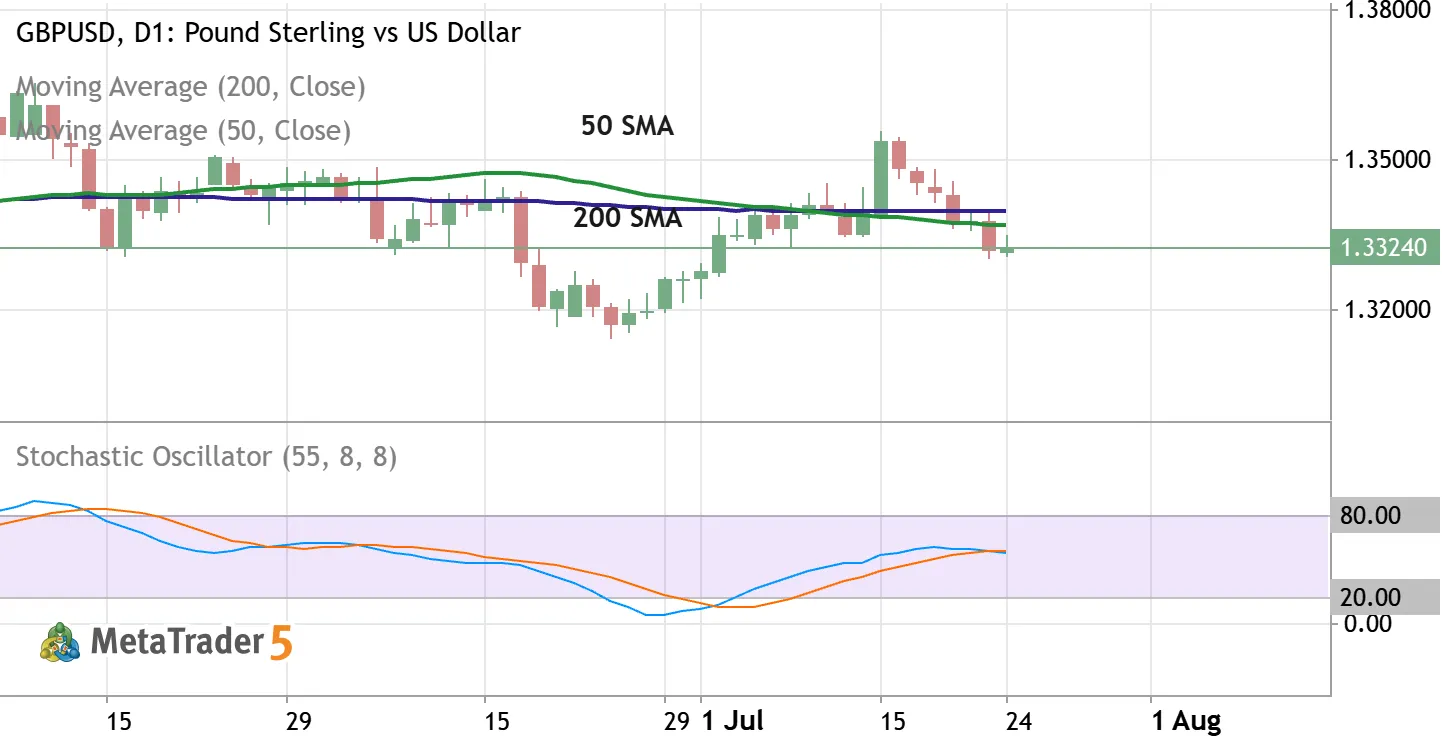
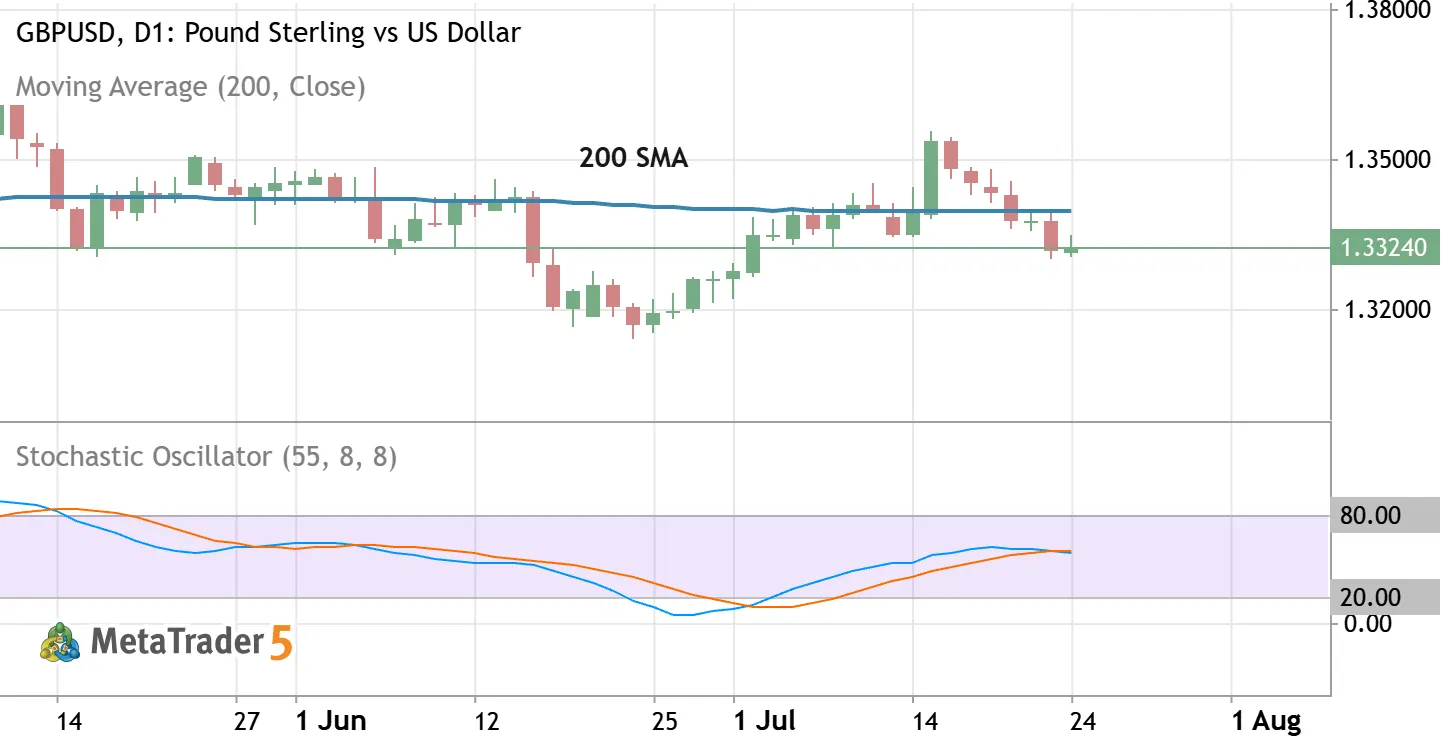
A simple and reliable educational setup. When the 50 SMA crosses above the 200 SMA from below, it signals a potential bullish move. When it crosses below from above, a bearish move may follow. Signals are rare but long-term. Adding Stochastic (55,8,8) helps confirm the momentum - look for it turning above 20 for longs or below 80 for shorts. This is an example about how two moving averages can define the trend.
0
newdigital Sergey Golubev 2026.07.26 05:46
Simple Trading Setup with Two Simple Moving Averages GBPUSD Pound Sterling vs US Dollar
Simple Trading Setup with Two Simple Moving Averages
A simple and reliable educational setup. When the 50 SMA crosses above the 200 SMA from below, it signals a potential bullish move. When it crosses below from above, a bearish move may follow. Signals are rare but long-term. Adding Stochastic (55,8,8) helps confirm the momentum - look for it turning above 20 for longs or below 80 for shorts. On GBPUSD D1, the last bullish crossover happened in early 2026, followed by a strong upward move. A classic example of how two moving averages can define the trend.
0
newdigital Sergey Golubev 2026.07.25 19:41
GBPUSD TRADE IDEA GBPUSD Long Pound Sterling vs US Dollar
GBPUSD TRADE IDEA
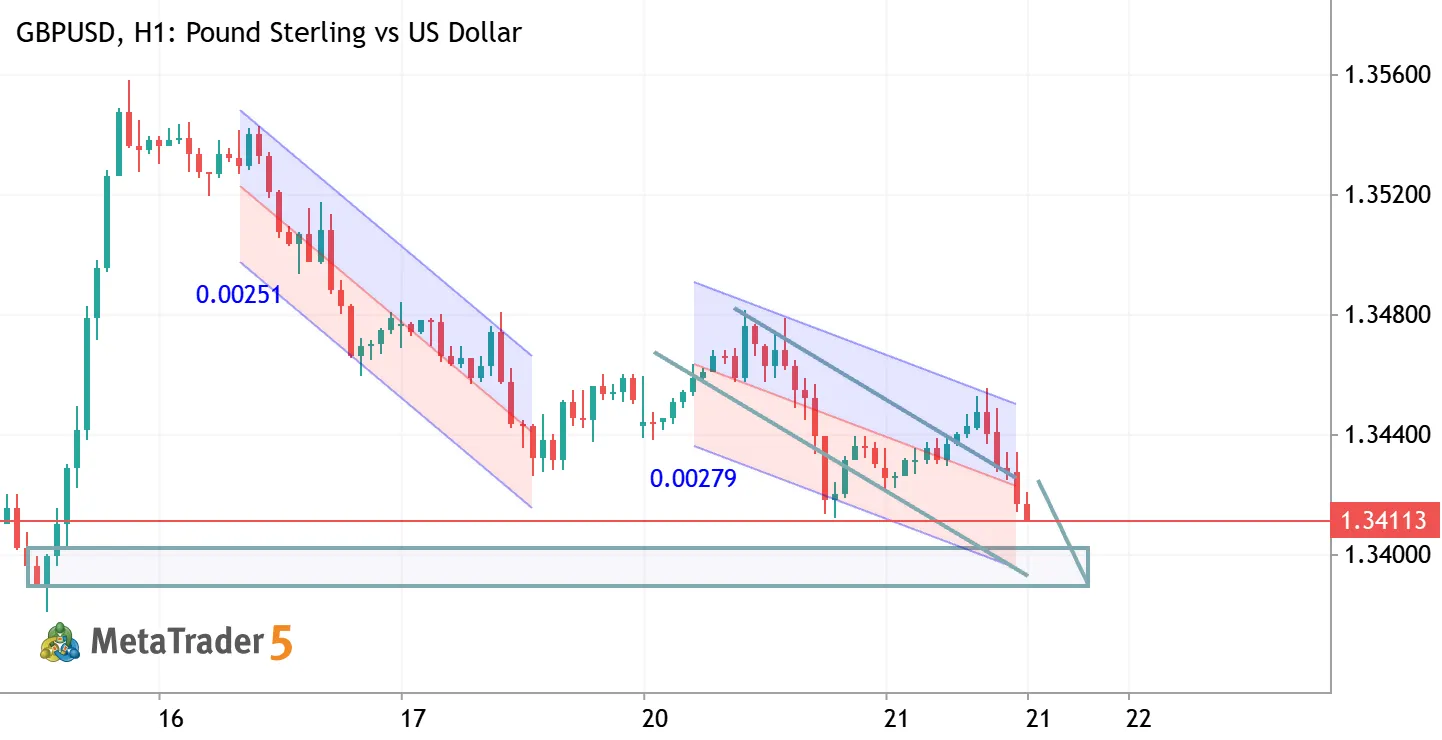
GBP/USD (H1) Bias: Bullish (counter-trend rebound Entry Zone: 1.3325 – 1.3335 Stop Loss: 1.3305 (below recent support Take Profit 1: 1.3360 Take Profit 2: 1.3385 Take Profit 3: 1.3400 Analysis: Price is holding above a recent support zone and showing signs of a short-term recovery. A sustained move above 1.3335 increases the probability of a bullish retracement toward the descending trendline resistance. The buy setup remains valid while price stays above 1.3305 .
0
HamadJatoi Hamad Jatoi 2026.07.24 15:13
GBPUSD H4 ANALYSIS GBPUSD Pound Sterling vs US Dollar
GBPUSD H4 ANALYSIS
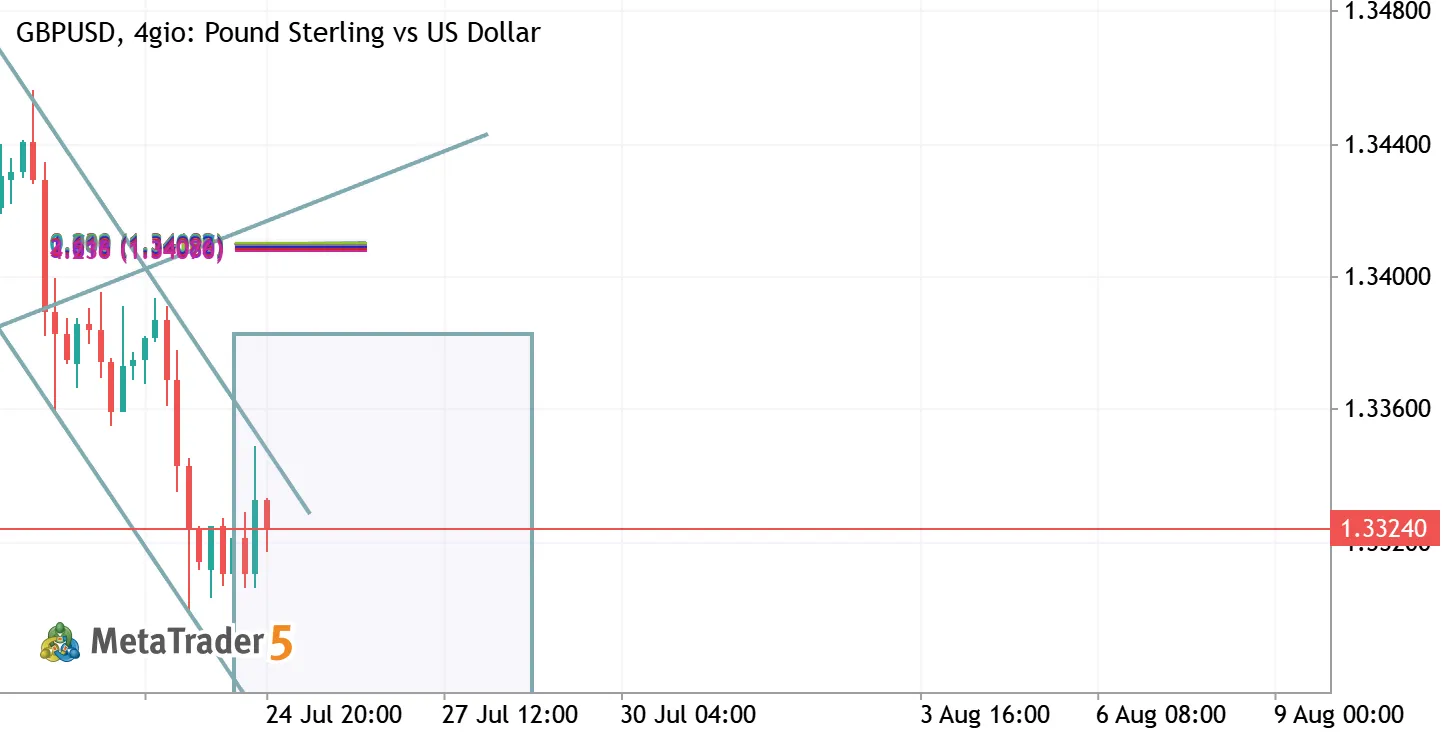
EURUSD Technical Analysis (H4) Price is showing a bullish structure after a strong recovery from the support zone. Buyers are defending the demand area, keeping the upside momentum active. 📈 Bullish scenario: A break above the recent resistance can open the way toward higher targets. 📉 Risk level: A drop below the support zone may invalidate the bullish setup. Key focus: Wait for confirmation at support/resistance levels before entry. #EURUSD #Forex #TechnicalAnalysis
0
Goldanalysisteam Abdul Qayoom 2026.07.22 09:47
GBPUSD ANALYSIS H1 GBPUSD Pound Sterling vs US Dollar
GBPUSD ANALYSIS H1
GBPUSD – Sell Bias 📉 GBPUSD | SELL Price is showing bearish pressure after rejecting a key resistance zone. The overall market structure favors sellers, with lower highs and weakening bullish momentum. If the price remains below resistance, further downside toward the next support levels is likely. Bias: Bearish 📉 Strategy: Sell on bearish confirmation. Risk Management: Wait for confirmation and always use a stop-loss. This analysis reflects current market structure and is not financial advice.
0
ZeeshanFx54 Zeeshan Fx 2026.07.21 11:10
GBPUSD TRADE IDEA GBPUSD Short Pound Sterling vs US Dollar
GBPUSD TRADE IDEA
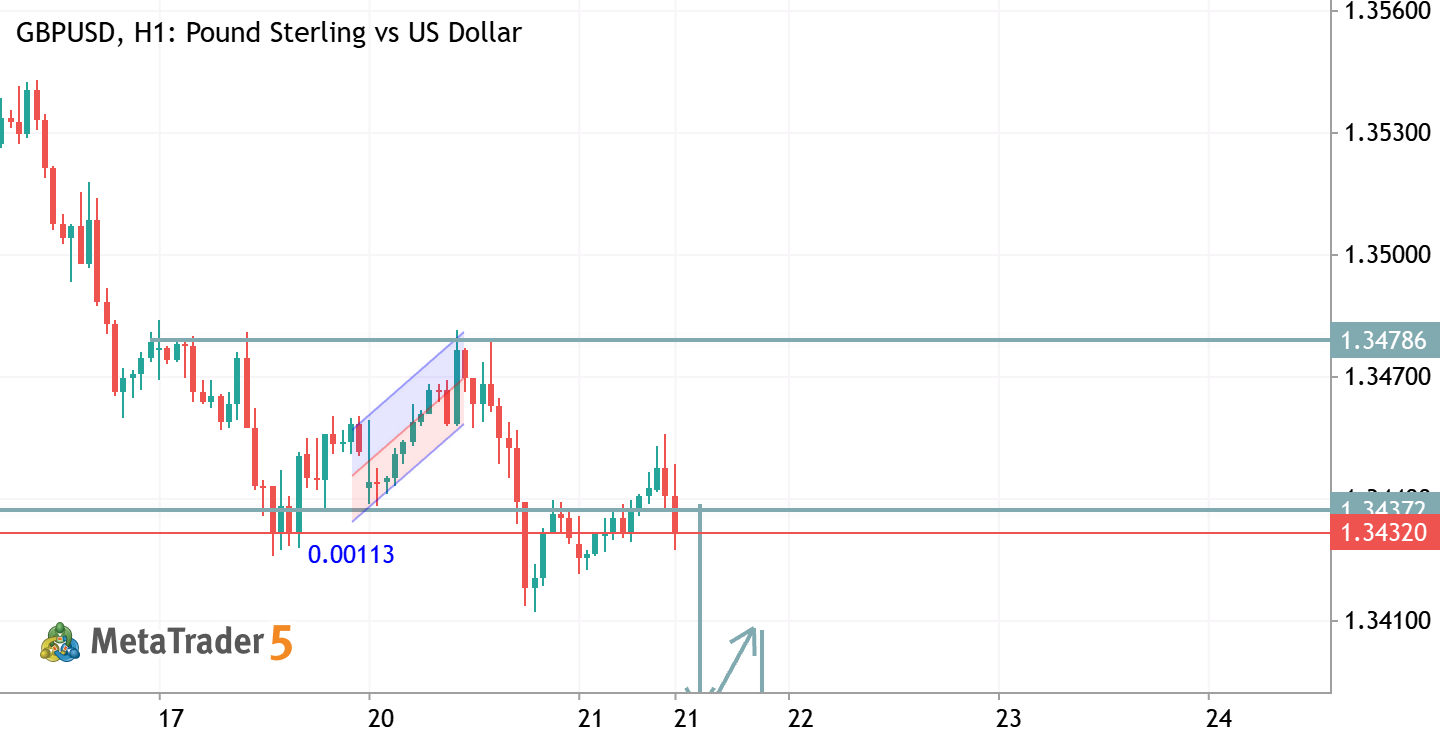
GBPUSD (H1) Bias: Bearish Based on the chart, price has rejected the 1.3478 resistance and is trading back below the 1.3437 pivot , indicating sellers are regaining control. The recent lower high and bearish momentum favor a continuation lower unless buyers reclaim resistance. Sell Entry Zone: 1.3430 – 1.3445 (on a pullback/retest) Take Profit Targets: TP1: 1.3387 (nearest support) TP2: 1.3345 (major support) Stop Loss: Above 1.3480 Bullish Invalidation: A strong H1 candle closing above 1.3478 would weaken the bearish setup and could trigger a move toward higher resistance. Your chart currently favors downside continuation toward the marked support levels. Recent GBP/USD technical commentary also notes that failure to hold above nearby resistance can keep short-term selling pressure
0
HamadJatoi Hamad Jatoi 2026.07.21 08:53
EURUSD H1 ANALYSIS EURUSD Euro vs US Dollar
EURUSD H1 ANALYSIS
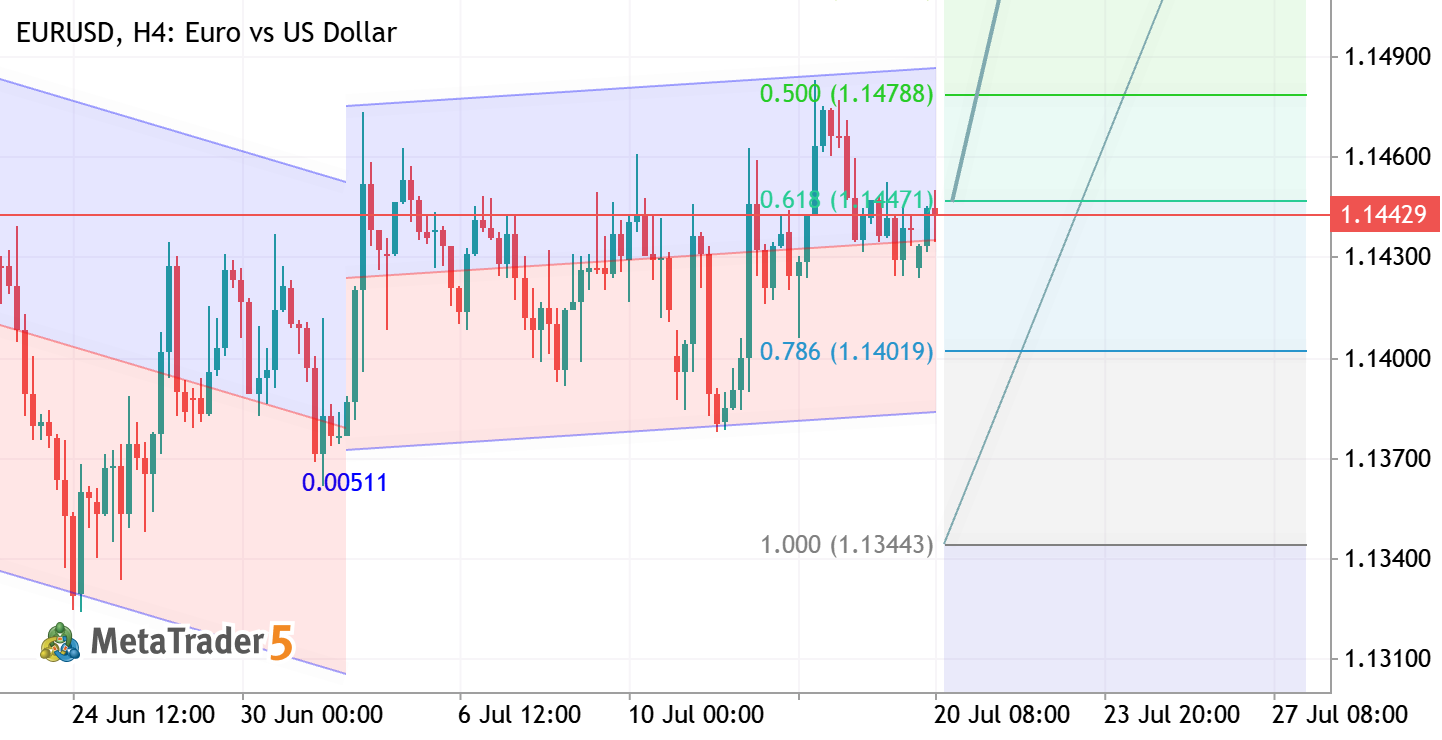
EURUSD – H4 Outlook Price is holding above the key Fibonacci support zone, signaling bullish strength. As long as buyers defend 1.1400–1.1420, the pair remains positioned for a move toward 1.1615. Bias: Bullish Support: 1.1400–1.1420 Target: 1.1550 → 1.1615 A sustained hold above support keeps the upside scenario valid, while a break below 1.1400 would weaken the bullish outlook. Always wait for confirmation and apply proper risk management.
0
Goldanalysisteam Abdul Qayoom 2026.07.20 08:42
GBPUSD H1 ANALYSIS GBPUSD Pound Sterling vs US Dollar
GBPUSD H1 ANALYSIS
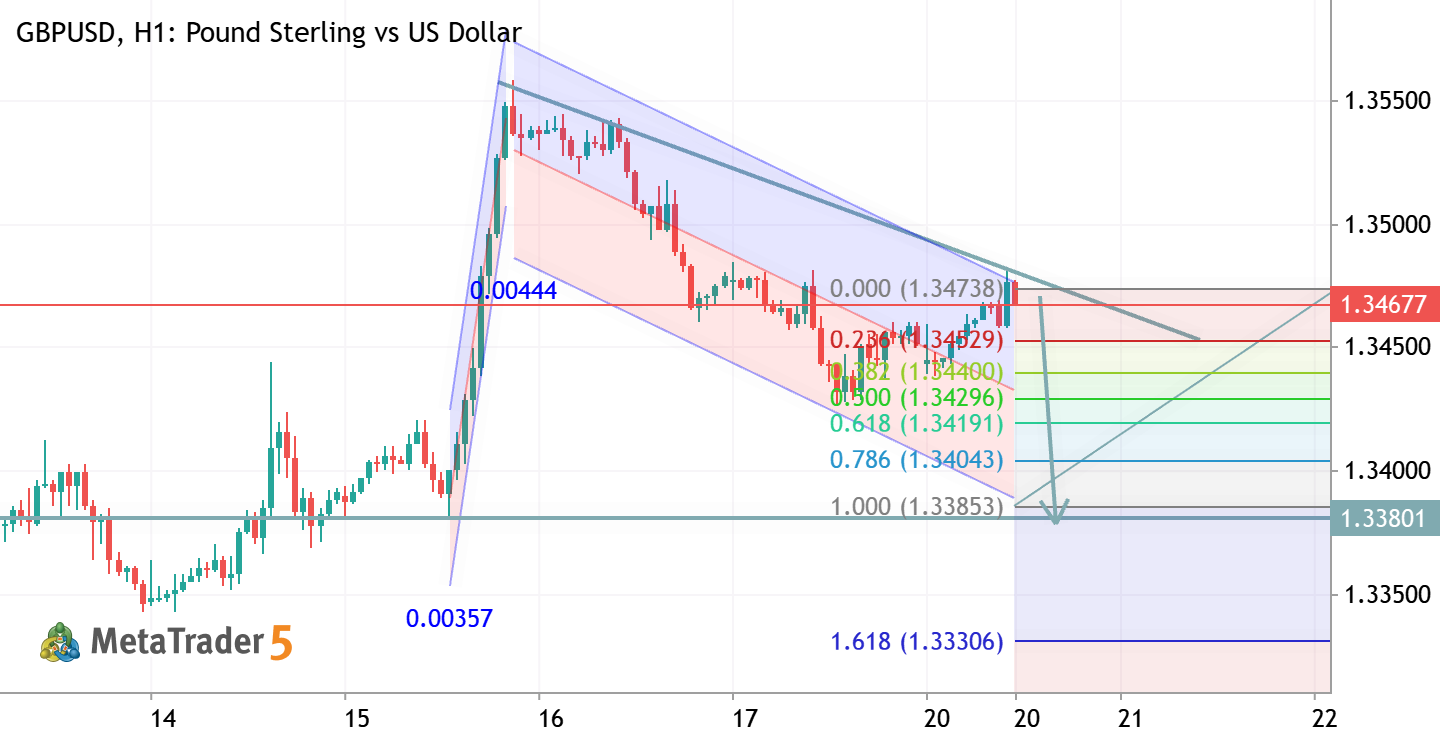
GBPUSD – H1 Quick Analysis Price is recovering from the Fibonacci support zone after respecting the lower boundary of the descending channel. Buyers are attempting to regain momentum, with the next focus on the channel resistance. Bias: Bullish above support. Key Resistance: 1.3465–1.3480. Key Support: 1.3400–1.3385. A confirmed breakout above the channel could trigger further upside, while rejection at resistance may lead to another pullback toward the support zone. Trade with proper risk management and wait for candle confirmation before entry.
0
Goldanalysisteam Abdul Qayoom 2026.07.20 08:28
GBPUSD TRADE IDEA GBPUSD Long Pound Sterling vs US Dollar
GBPUSD TRADE IDEA
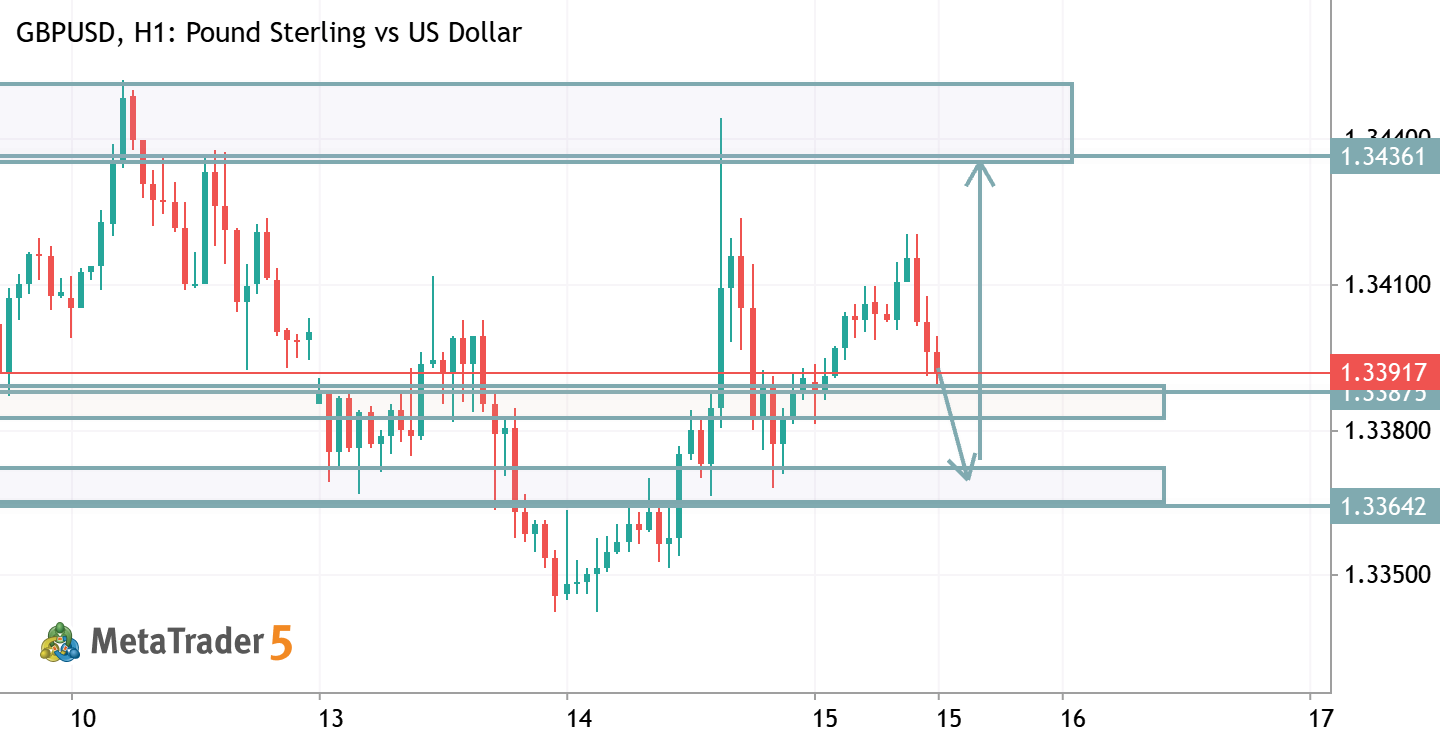
GBPUSD (H1) Bias: Bullish above 1.3387–1.3392 support. Key Resistance: 1.3435–1.3450 supply zone. Key Support: 1.3387 then 1.3364 . Buy Setup Buy on a successful retest and bullish rejection from 1.3387–1.3392 . Targets: 1.3435 → 1.3450 . Stop Loss: Below 1.3364 . Alternative Scenario If price breaks and closes below 1.3364 , bullish momentum weakens and a move toward 1.3345–1.3330 becomes more likely. Overall, the chart still favors buying from support , with the 1.3435–1.3450 resistance zone as the primary upside target.
0
HamadJatoi Hamad Jatoi 2026.07.15 09:53
GBPUSD TRADE IDEA GBPUSD Long Pound Sterling vs US Dollar
GBPUSD TRADE IDEA
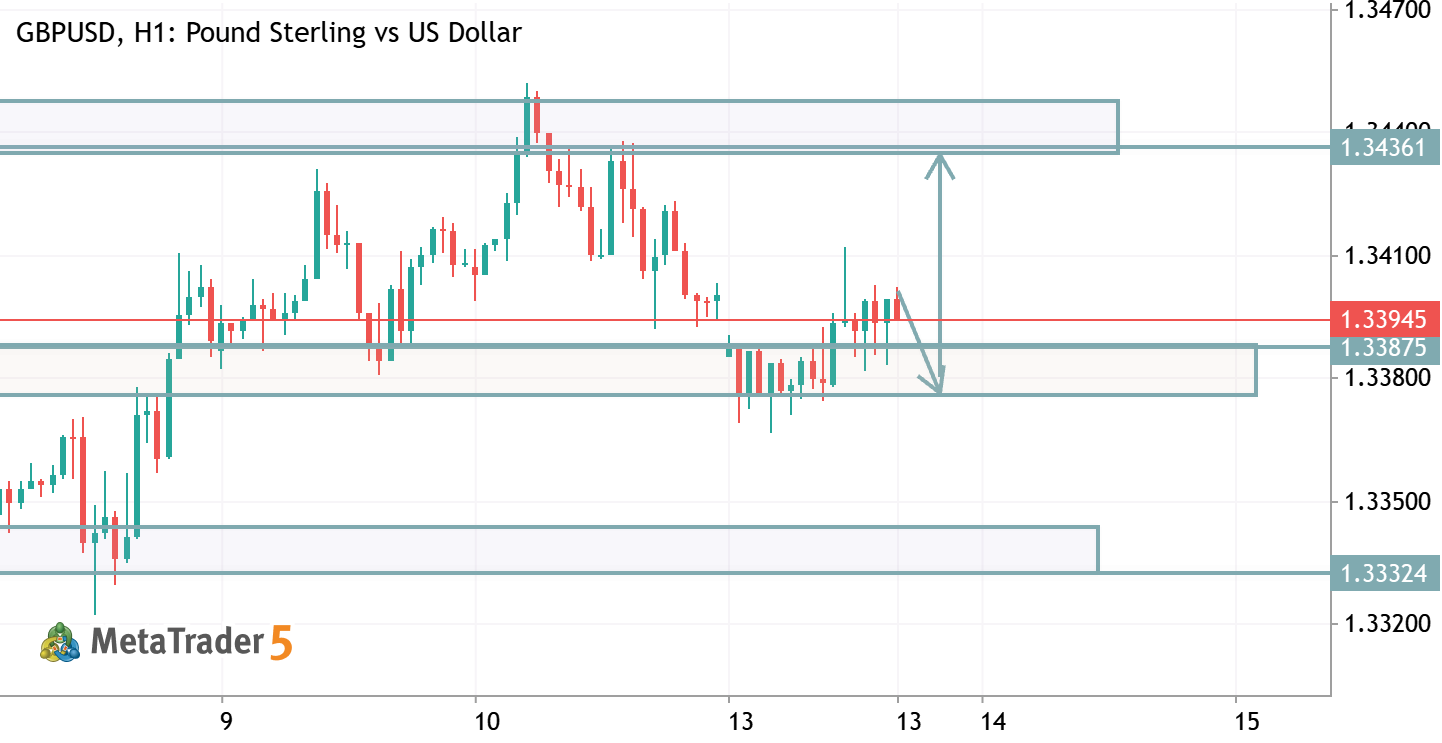
GBPUSD (H1) – Bias: BUY (while above support) Buy Entry: 1.3380–1.3390 (support/retest zone) Stop Loss: Below 1.3375 Take Profit 1: 1.3436 Take Profit 2: 1.3448 Alternative Scenario: If price breaks and closes below 1.3380 , bullish momentum weakens and GBPUSD could decline toward 1.3350–1.3332 . Summary: Price is holding a key support zone. A bullish reaction from 1.3380–1.3390 favors a move toward 1.3436 and potentially 1.3448 . A confirmed break below support invalidates the buy setup.
1
HamadJatoi Hamad Jatoi 2026.07.13 13:16