GBPUSD TRADE IDEA GBPUSD Long Pound Sterling vs US Dollar
GBPUSD TRADE IDEA
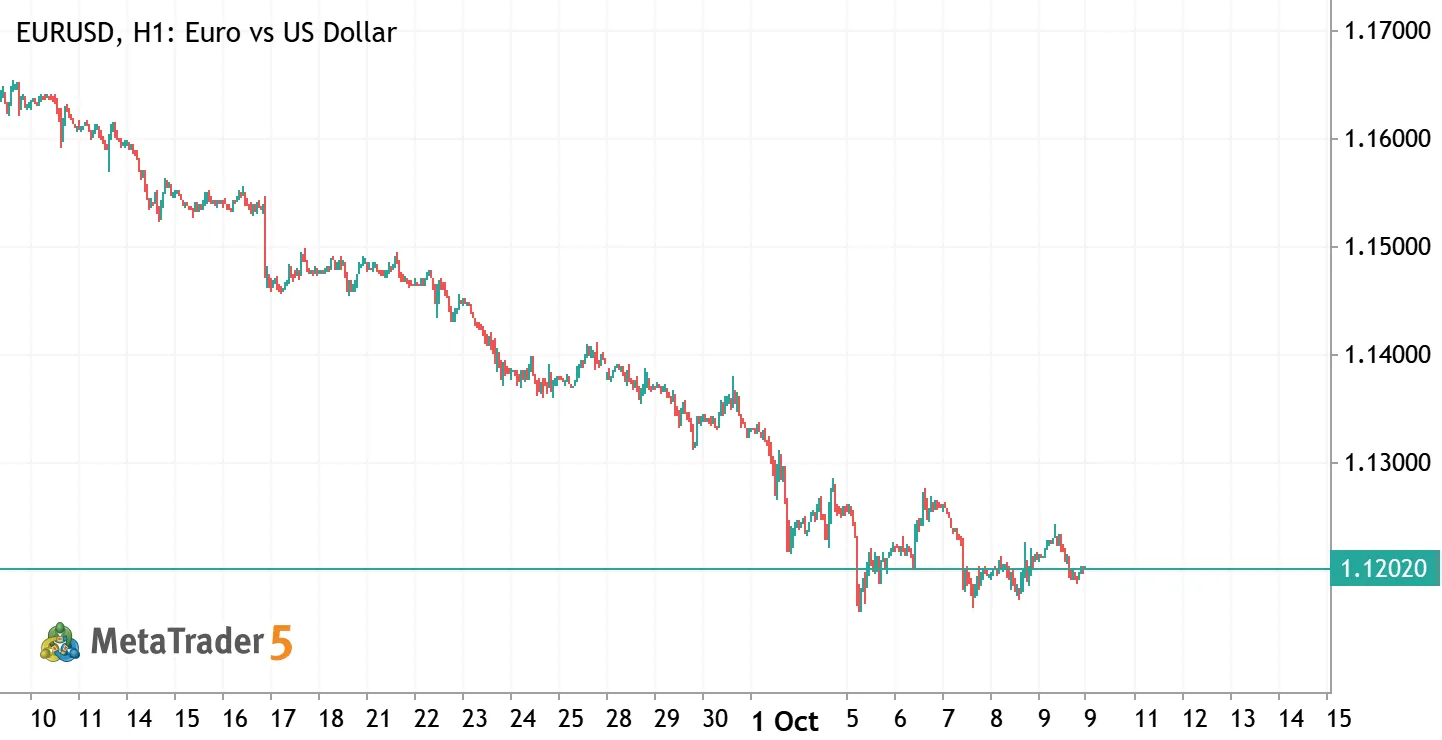
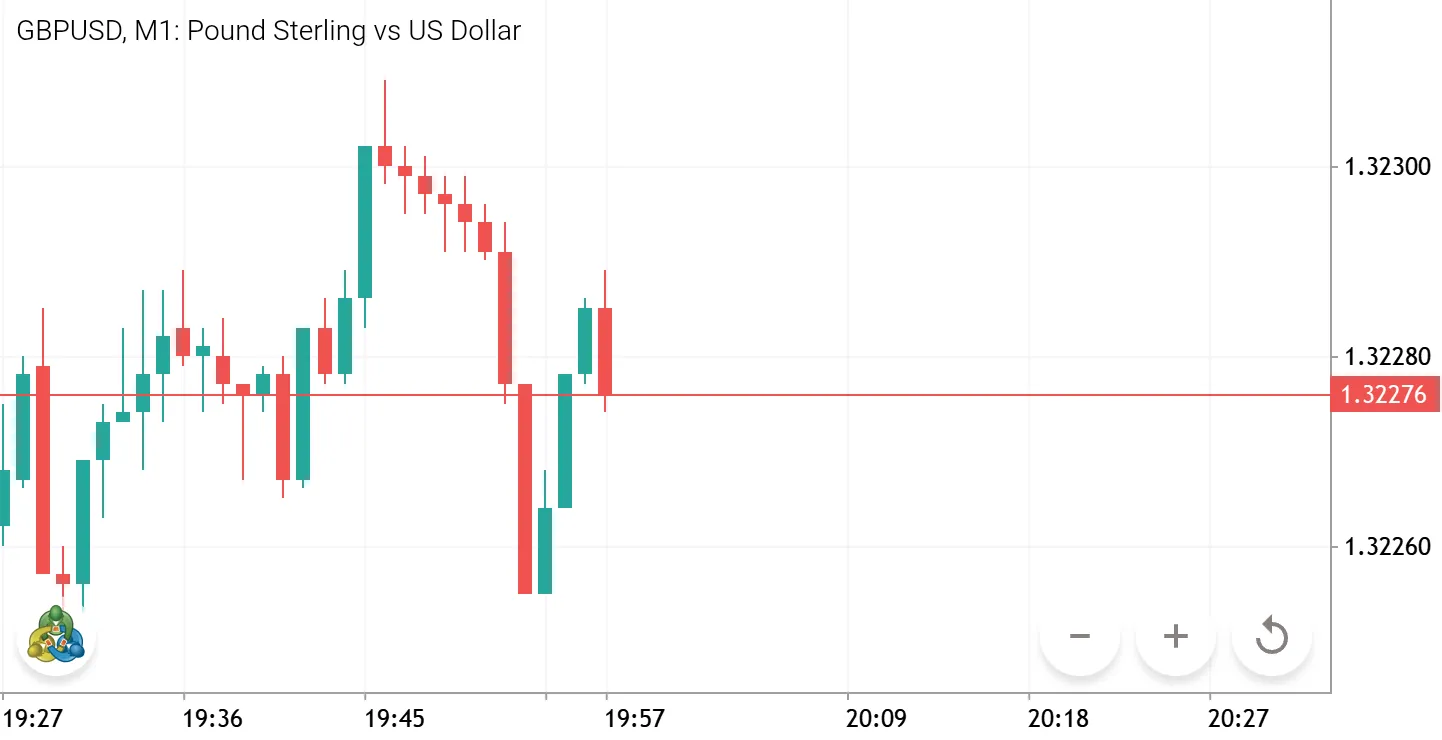
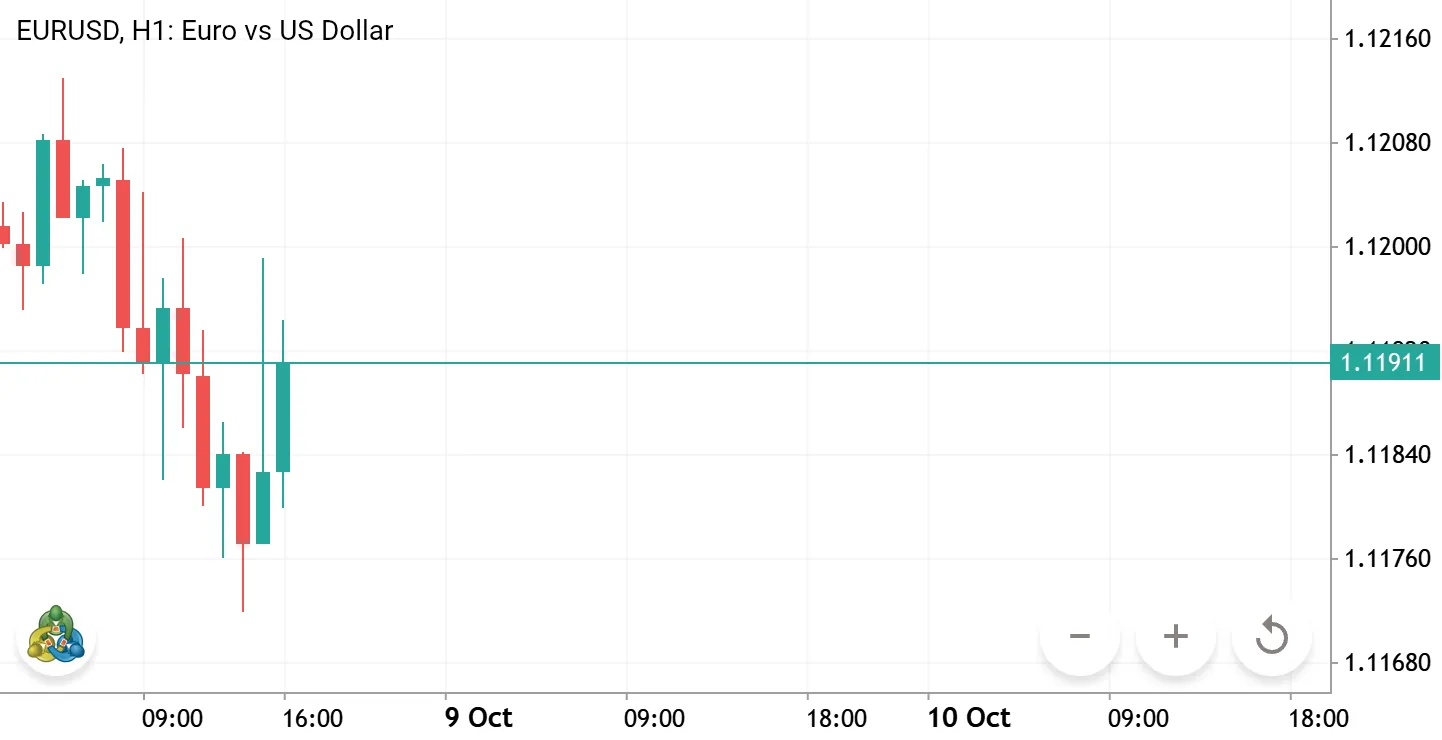
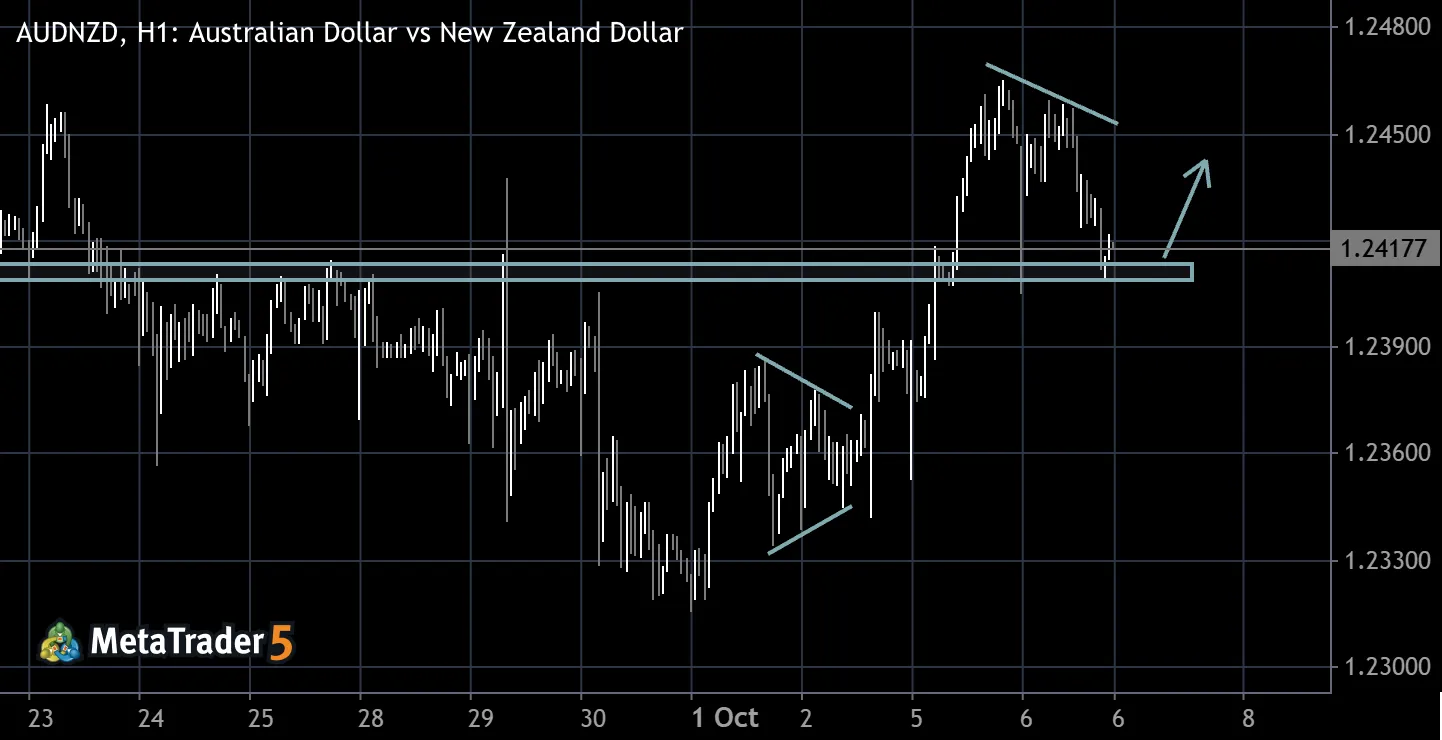
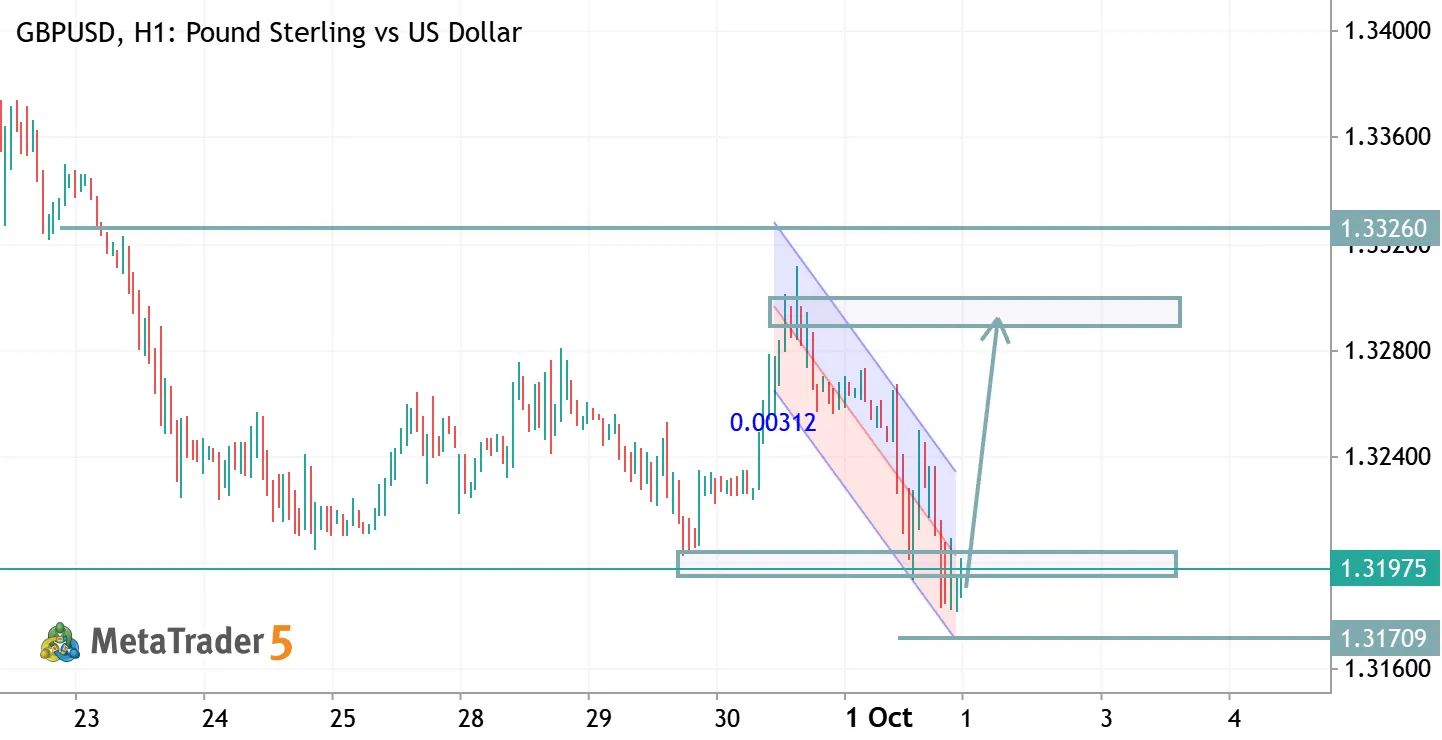
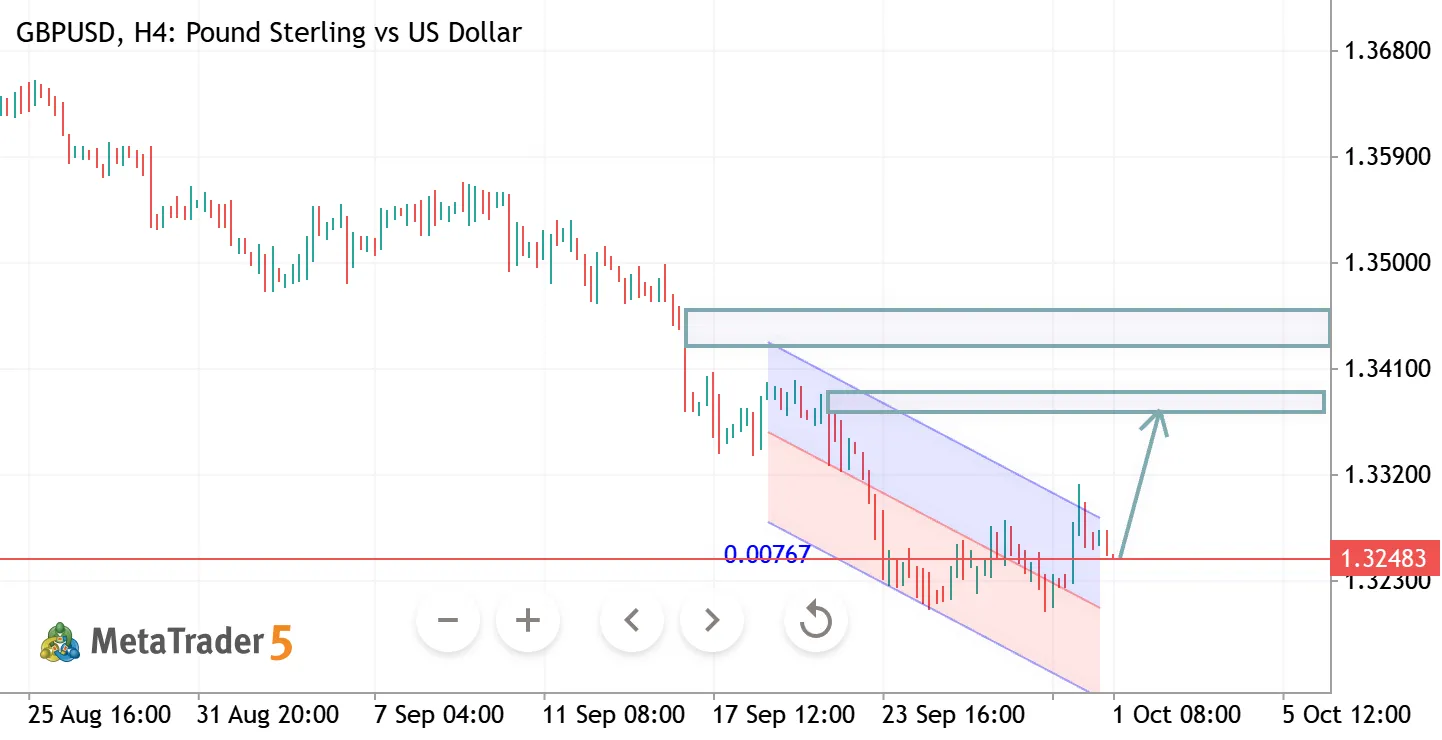
GBPUSD (H1) – Bias: BUY (while above support) Buy Entry: 1.3380–1.3390 (support/retest zone) Stop Loss: Below 1.3375 Take Profit 1: 1.3436 Take Profit 2: 1.3448 Alternative Scenario: If price breaks and closes below 1.3380 , bullish momentum weakens and GBPUSD could decline toward 1.3350–1.3332 . Summary: Price is holding a key support zone. A bullish reaction from 1.3380–1.3390 favors a move toward 1.3436 and potentially 1.3448 . A confirmed break below support invalidates the buy setup.
0
HamadJatoi Hamad Jatoi 2026.07.13 13:16
Money Flow Index - traditional general approach USDSGD US Dollar vs Singapore Dollar
Money Flow Index - traditional general approach
Money Flow Index (MFI) is a momentum indicator that measures the rate at which money is invested into or withdrawn from a security. Traditional general approach to use MFI is the using it as the Trend Filter: MFI (14) + Simple Moving Average (SMA with period 200) on the price chart. Buy Rule (Long) : price is above the SMA. Wait for the MFI to drop below 20 (oversold) and start rising. Sell Rule (Short) : price is below the SMA. Wait for the MFI to rise above 80 (overbought) and start falling. Traders often monitor these zones for potential price peaks or bottoms.
0
newdigital Sergey Golubev 2026.07.12 12:40
USDKRW - Daily Trading Forecast USDKRW Short US Dollar vs South korean won
USDKRW - Daily Trading Forecast
Daily price was bounced from resistance level at 1560.66 to below for the secondary correction to the bearish reversal to be started. Chinkou span line of Ichimoku indicator is crossing the historical price to below for the good breakdown to be started, and Stochastic oscillator is showing the overbought level for the price. Thus, finally, the price is testing 1496.68 support level to below for the primary daily bearish reversal. If the price breaks resistance level at 1560.66 to above on the daily close bar so the primary bullish trend will be resumed. If the price crosses 1496.68 support level to below so the daily bearish reversal will be started with 1461.35 as the possible target. Alternatively, the price will be on ranging to be near and inside Ichimoku cloud waiting for direction
0
newdigital Sergey Golubev 2026.07.10 14:42
GBPUSD TRADE IDEA GBPUSD Long Pound Sterling vs US Dollar
GBPUSD TRADE IDEA
Bias: Bullish only if support holds. Support Zone: 1.3340 – 1.3330 Buy Entry: Wait for price to reject 1.3340 – 1.3330 with a bullish engulfing candle, strong bullish pin bar, or higher-low formation. Stop Loss: Below 1.3325 Take Profit 1: 1.3360 Take Profit 2: 1.3383 Take Profit 3: 1.3405 (if price breaks above resistance with strong momentum) Confirmation: Do not buy while price is still falling. Wait for a clear bullish reversal signal at the support zone before entering. A break below 1.3330 invalidates the buy setup and increases the probability of further downside.
0
HamadJatoi Hamad Jatoi 2026.07.07 19:52
GBPUSD TRADE IDEA GBPUSD Short Pound Sterling vs US Dollar
GBPUSD TRADE IDEA
GBP/USD (M30) Trade Setup 🔴 Short (Sell) Entry Entry: 1.3385 – 1.3392 Stop Loss: 1.3408 Take Profit 1: 1.3361 Take Profit 2: 1.3345 Take Profit 3: 1.3335 Confirmation: Wait for a bearish rejection candle or bearish engulfing pattern at the resistance zone before entering. 🟢 Buy Entry Buy only if price retraces into support . Entry: 1.3335 – 1.3342 Stop Loss: 1.3320 Take Profit 1: 1.3361 Take Profit 2: 1.3383 Take Profit 3: 1.3390 Alternative Buy: If price closes strongly above 1.3395 and then retests it as support, look for buy confirmations targeting 1.3410+ . Current Bias: Sell from resistance has the higher probability until 1.3395 is broken decisively.
1
HamadJatoi Hamad Jatoi 2026.07.06 21:20
Avesome Oscillator - traditional general approach USDBRL US Dollar vs Brazilian Real
Avesome Oscillator - traditional general approach
Awesome Oscillator (AO) is a momentum indicator that reflects market trend changes by comparing recent market velocity with historical velocity. The traditional trading approach focuses on capturing macro-driven trends and avoiding false breakouts caused by the pair's typical high volatility. Zero-Line Crossover This is the simplest trend-following signal indicating a shift in market direction. Bullish Signal (Buy): AO crosses from below zero to above zero. Bearish Signal (Sell): AO crosses from above zero to below zero. Apply Filter It can be 200-SMA or Ichimoku cloud for example. Only look for Buy signals if the price is above the 200-SMA or Ichimoku cloud. Only look for Sell signals if the price is below the 200-SMA or Ichimoku cloud. Best used on daily (D1) charts to capture large
0
newdigital Sergey Golubev 2026.07.05 05:04
GBPUSD H4 ANALYSIS GBPUSD Pound Sterling vs US Dollar
GBPUSD H4 ANALYSIS
GBPUSD – Technical Outlook Price has reached a key resistance zone after completing a strong bullish move inside the rising structure. Rejection from the upper boundary suggests bearish momentum may build if sellers maintain control. A break below 1.3215 could trigger a move toward the 1.3180–1.3140 support area. Bulls remain valid only if price reclaims and holds above the recent high. Bias: Bearish below resistance 📉
1
Goldanalysisteam Abdul Qayoom 2026.07.02 09:06