Gator Oscillator - traditional general approach
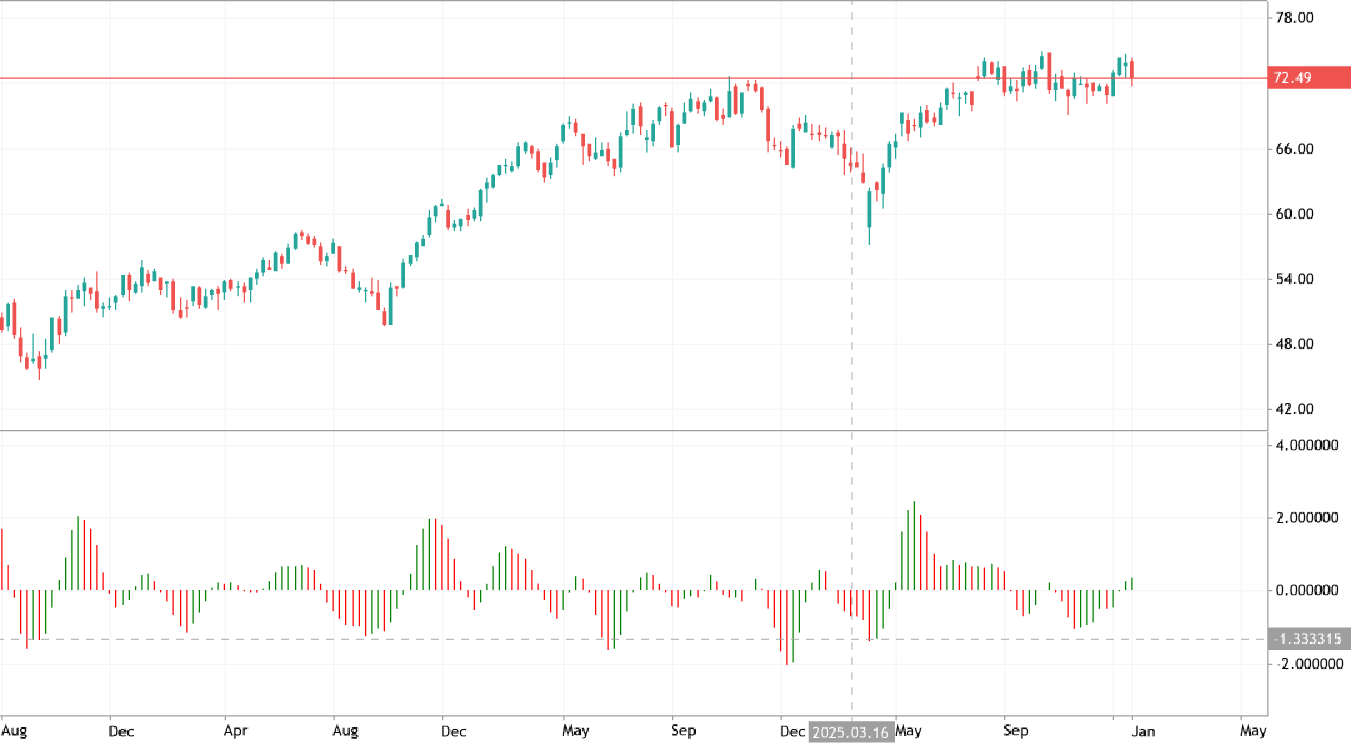
Gator Oscillator indicator was developed by Bill Williams to identify the market condition about the trend or ranging. Besides, the oscillator is measuring trend strength and identifies market phases: sleeping, awakening, eating, sated. Sleeping: Both bars are red, indicating no trend. Awakening: One bar is green, the other is red, signalling a new trend. Eating: Both bars are green, suggesting a strengthening trend. Sated: A red bar appears after an eating phase, suggesting the trend is ending. Trading Summary: The indicator is mostly used as a confirmation tool to avoid trading during consolidation.
0