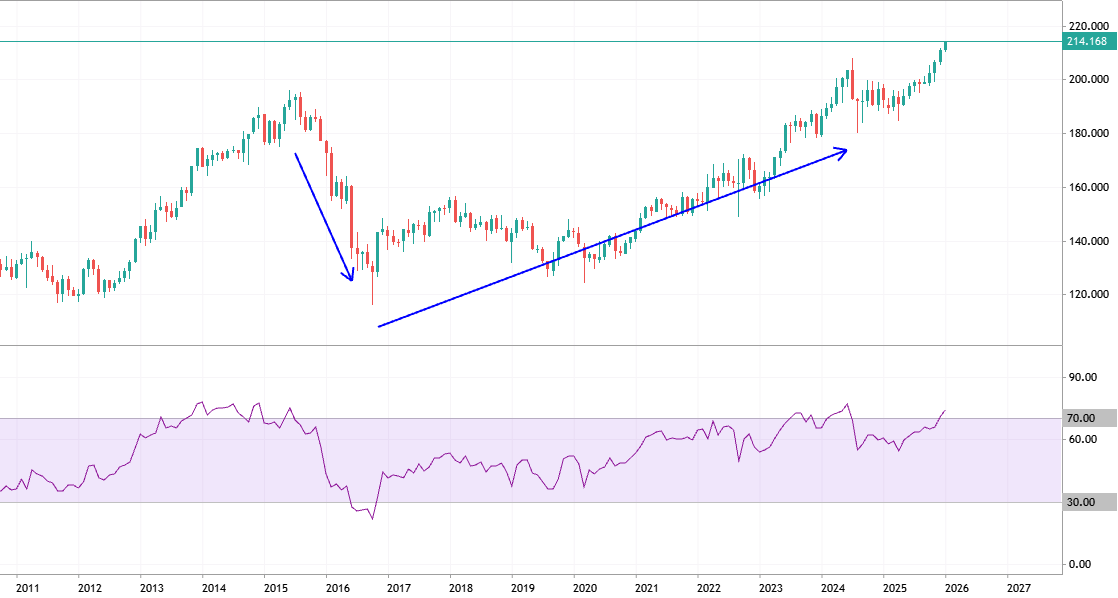
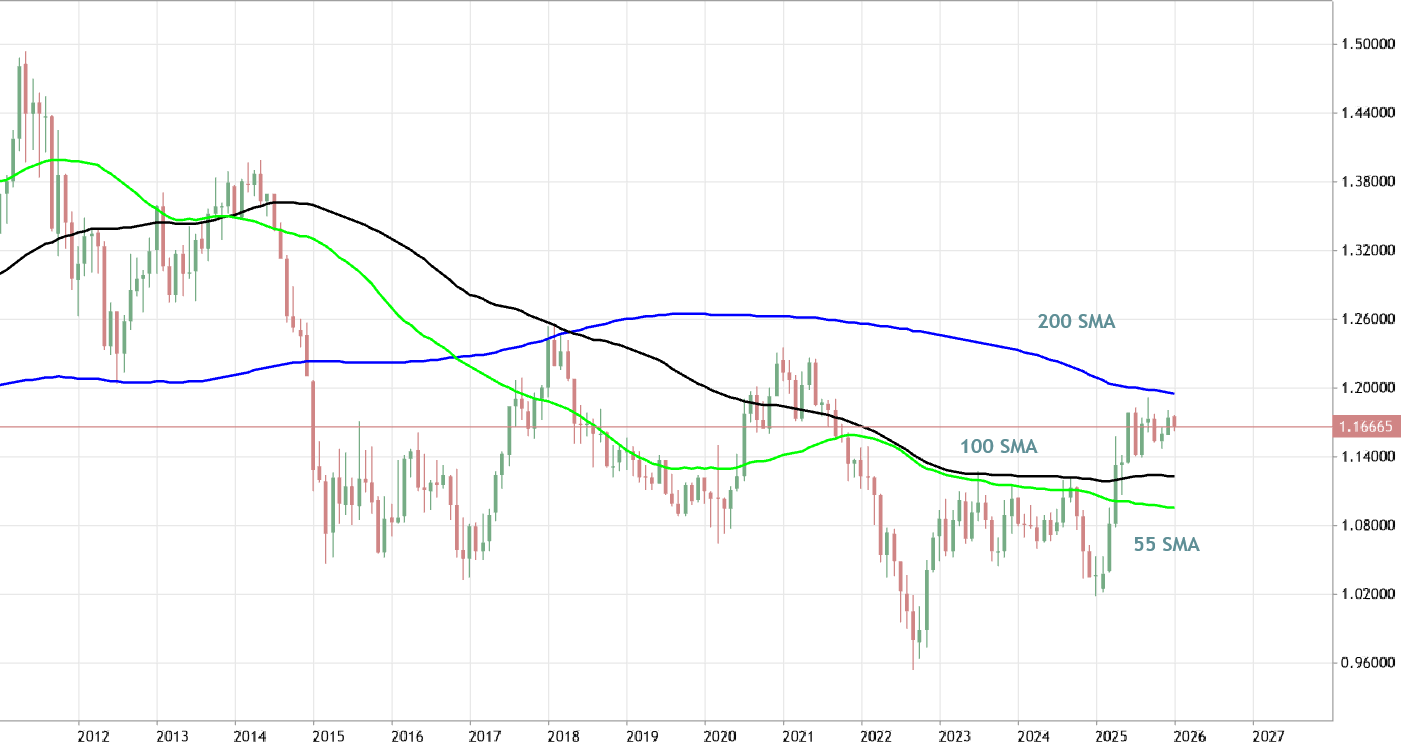
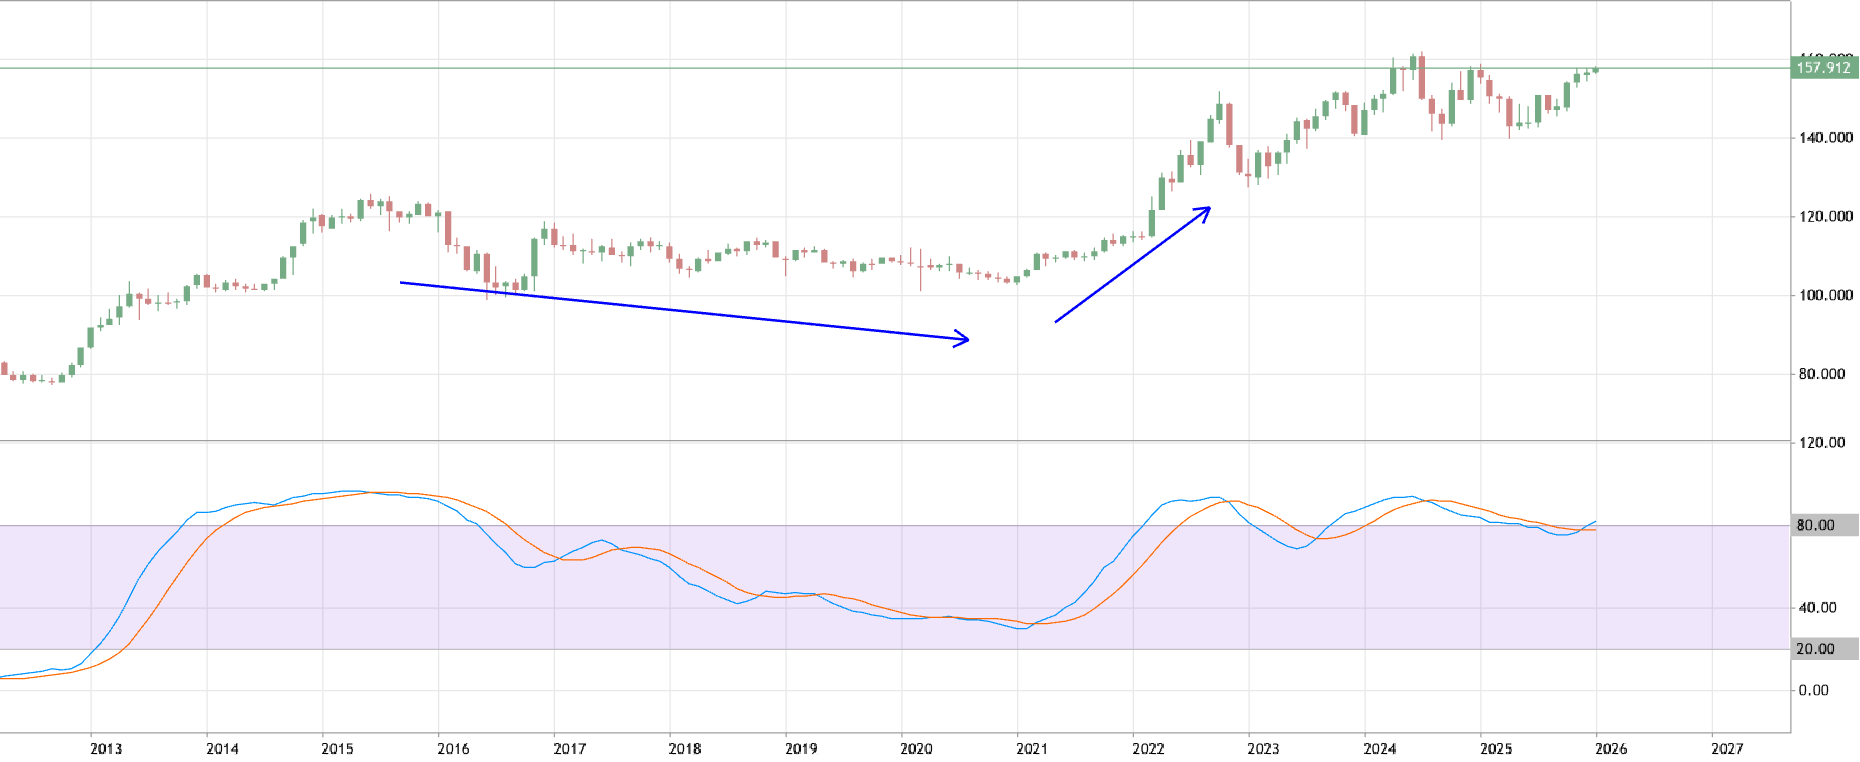
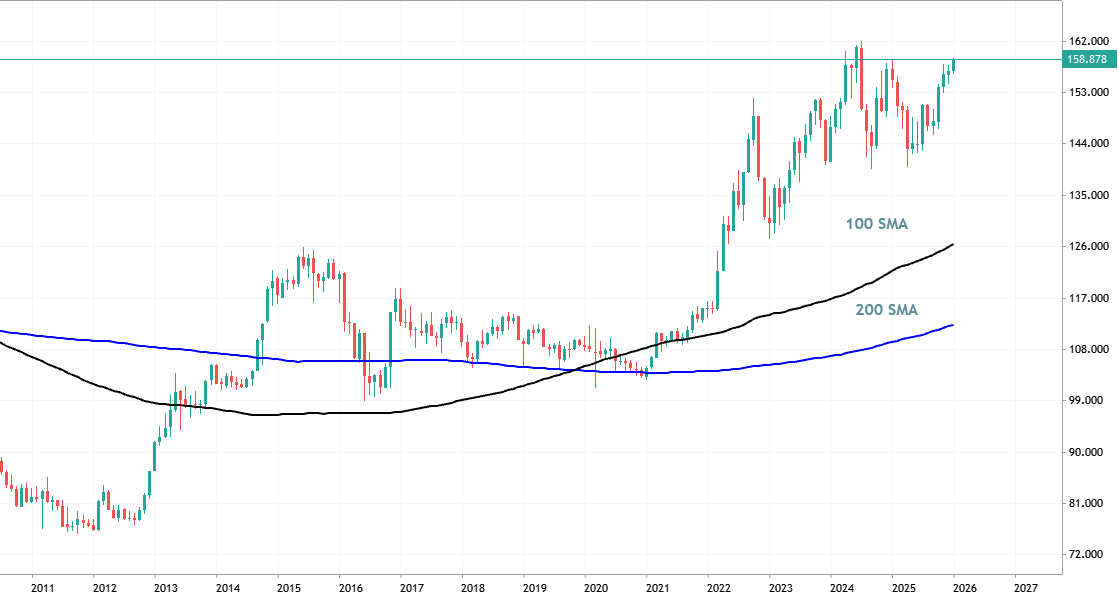
Moving Averages - traditional general approach EURUSD Euro vs US Dollar
Moving Averages - traditional general approach
Moving Average (MA for short) is a technical tool that averages a currency pair’s price over a period of time. The smoothing effect this has on the chart helps give a clearer indication on what direction the pair is moving either up, down, or sideways. There are a variety of moving averages to choose from. Simple Moving Averages and Exponential Moving Averages are by far the most popular. The traders are usually using SMA indicators with the period of 100 and 200 to estimate the market condition, and with the periods of 55 and 11 for intra-day trading for example.
0
newdigital Sergey Golubev 2026.01.13 05:33
Momentum Indicator - Overbought/Oversold Levels approach
500
US500 US SPX 500 Index
Momentum Indicator - Overbought/Oversold Levels approach
Momentum is used as an overbought/oversold indicator, to identify potential overbought and oversold levels based on previous indicator readings; The previous high or low of the momentum indicator is used to determine the overbought and oversold levels. Readings above the overbought level mean the currency pair is overbought and a price correction is pending. While readings below the oversold level the currency is oversold and a price rally is pending.
0
newdigital Sergey Golubev 2026.01.10 08:28
Momentum Indicator - Trend Line Breakouts approach
40
DE40 Germany 40 Index
Momentum Indicator - Trend Line Breakouts approach
Trend lines can be drawn on the Momentum indicator connecting the peaks and troughs. Momentum is a leading indicator and it begins to turn before price thereby making it a leading indicator. Bullish reversal- Momentum indicator readings breaking above a downward trend line warns of a possible bullish reversal signal while. Bearish reversal- momentum readings breaking below an upward trend line warns of a possible bearish reversal signal.
0
newdigital Sergey Golubev 2026.01.10 08:22
Stochastics - traditional general approach USDJPY US Dollar vs Yen
Stochastics - traditional general approach
Stochastics offer traders a different approach to calculate price oscillations by tracking how far the current price is from the lowest low of the last X number of periods. This distance is then divided by the difference between the high and low price during the same number of periods. The line created, %K, is then used to create a moving average, %D, that is placed directly on top of the %K. The result is two lines moving between 0-100 with overbought and oversold levels at 80 and 20. Traders can wait for the two lines to crosses while in overbought or oversold territories or they can look for divergence between the stochastic and the actual price before placing a trade.
0
newdigital Sergey Golubev 2026.01.10 07:44
200 SMA: the most easy way to estimate the trend - part #2 (secondary trend) XNGUSD Natural Gas vs US Dollar
200 SMA: the most easy way to estimate the trend - part #2 (secondary trend)
Once we know about how to estimate the primary trend (the price to be above/below 200 SMA for example) so we can estimate the secondary trend of it by looking at the other two SMA indicators: 55 SMA (as the fast one) and 100 SMA (as the medium/slow one). The secondary trend (correction and bear market rally) can be received by the combination of those two indicator. On the chart above: the price broke 200 SMA to below for the primary bearish reversal but fast SMA (55 SMA) crossed 100 SMA to above for the bear market rally in the near future for example.
0
newdigital Sergey Golubev 2026.01.10 02:16
200 SMA: the most easy way to estimate the trend - part #1 (primary trend)
40
DE40 Germany 40 Index
200 SMA: the most easy way to estimate the trend - part #1 (primary trend)
One of the most easy way to estimate the primary trend is 200 SMA. It means the following: if the price is located above 200 SMA so it means that the price is located in the bullish area of the chart; if the price is below 200 SMA so it should be considered as the primary bearish trend. For example, the DE40 weekly price is breaking resistance line at 24800 to above for the strong bullish trend to be continuing (with all SMA indicator's agreement with that). There are some particularities about how to estimate the secondary trend within the primary bearish/bullish which are related to the following: rising/declining 200 SMA line, and the combination of the other SMA indicators (100 SMA and 55 SMA) compare with the located of the price itself. But it may shortly be explained in the part #2.
0
newdigital Sergey Golubev 2026.01.08 15:30
MACD - traditional general approach
500
US500 US SPX 500 Index
MACD - traditional general approach
The Moving Average Convergence/Divergence tracks the difference between two EMA lines, the 12 EMA and 26 EMA. The difference between the two EMAs is then drawn on a sub-chart (called the MACD line) with a 9 EMA drawn directly on top of it (called the Signal line). Traders then look to buy when the MACD line crosses above the signal line and look to sell when the MACD line crosses below the signal line.
2
newdigital Sergey Golubev 2025.12.18 13:13
Trend following: Moving Averages indicator to open the positions on the direction of the primary trend AMZN Amazon.com, Inc. - Common Stock
Trend following: Moving Averages indicator to open the positions on the direction of the primary trend
Moving averages indicator is commonly used for estimation of the primary trend as well as the secondary correction and bear market rally for example. Traders choose the moving average period depending on the type of trading they do: short-term, medium-term or long-term. Short-term: 10 -55 period Moving Average (11 and 55 are usually used on lower timeframe). Medium-term: 55 - 100 period Moving Average (or the combination of 55 SMA together with 100 SMA). Long-term: 100 - 200 period Moving Average (or the combilation of 100 MA together with 200 MA). This indicator is providing the good view related to the market condition with all the aspects of the situation together with the possible entry points by using the well-known combinations of 2 or 3 indicators on one chart for example.
0
newdigital Sergey Golubev 2025.12.17 11:24
Bollinger Bands - indicator with lot of information for traders
500
US500 US SPX 500 Index
Bollinger Bands - indicator with lot of information for traders
Bollinger Bands indicator was developed by John Bollinger, and this indicator is providing a lot of information, for example: about low volatility- consolidation phase, periods of high volatility- extended trends, support/resistance and buy/sell entry points. The middle line is a simple moving average, the upper line = middle line + standard deviation, lower line = middle line - standard Deviation. Narrowing of Bands is a sign of consolidation and is known as the Bollinger band squeeze, and when the Bollinger Bands display narrow standard deviation it is usually a time of consolidation. The widening of Bands is a sign of a breakout and is known as the Bulge. So, many traders are using this indicator to estimate the market condition on the current timeframe to decide about buy or sell position to be taken for their personal strategy for example.
0
newdigital Sergey Golubev 2025.12.17 11:01
Market condition evaluation by using two SMA indicators BTCUSD Bitcoin vs US Dollar
Market condition evaluation by using two SMA indicators
One of the main problem for the traders is about how to estimate the Market condition in simple (but effective) way. And this moethod is really great: just plot two SMA indicators with the period of 100 and 200, and after that - look at the chart: if those two indicator is on uptrend and the price is above the two indicator so it is primary bullish market condition; opposite - for bearish trend. But if the price is located between those two indicator so it is secondary ranging condition, means: waiting for direction. It is really simply but effective method to estimate the market condition in the beginning of the trading session for example.
0
newdigital Sergey Golubev 2025.12.17 10:03