

NVDA
#1
NVIDIA Corporation - Common Stock
210.9 6 USD
-0.01%
Market Price
부문: 기술
베이스: USD
수익 통화: USD
일일 변동 비율
년간 변동
일일 변동
-0.59%
월간 변동
-6.30%
6달 변화
+0.62%
년간 변동율
+11.04%
이전 종가
212.2 1
Open
210.9 4
저가
210.1 8
고가
213.8 5
Financials
값 202020212022202320242025 TTM
뉴스
AI 붐은 1999년과 다르며, 빅테크가 시장 붕괴를 완화할 수 있다고 한 CEO가 말했다
전문가, 엔비디아 성장률 20%로 둔화될 수 있지만 주가는 여전히 두 배로 오를 수 있다고 전망
S&P 500 지수, 사상 최고치 근접했지만 60% 종목은 약세장···SPY가 더 큰 문제를 숨기고 있나?
스텔란티스 주가, 52주 신저가 기록···무슨 일 있었나?
단독: 한국 반도체 주식 매도세, SK하이닉스 실적 발표 앞두고 드문 ‘투매’ 신호 포착 - 애널리스트
애플, 엔비디아 제칠 수 있을까? 아이폰 듀오와 11월 2일 실적 발표가 관건
뉴에그, 미국·캐나다에서 엔비디아 RTX 스파크 노트북 출시 발표
평균 주식, S&P 500 지수 대비 2009년 4월 이후 최대 폭 초과 수익···섹터 로테이션 종료됐나?
포니AI와 엔비디아, 로보택시 사업 확장 위해 새로운 시장 진출
엔비디아의 AI 경고, 111달러 유가: SOXL이 20% 급락한 이유
CoreWeave, 물리 AI 워크로드 템플릿 'Physical AI Launchables' 출시
차트 & 아이디어
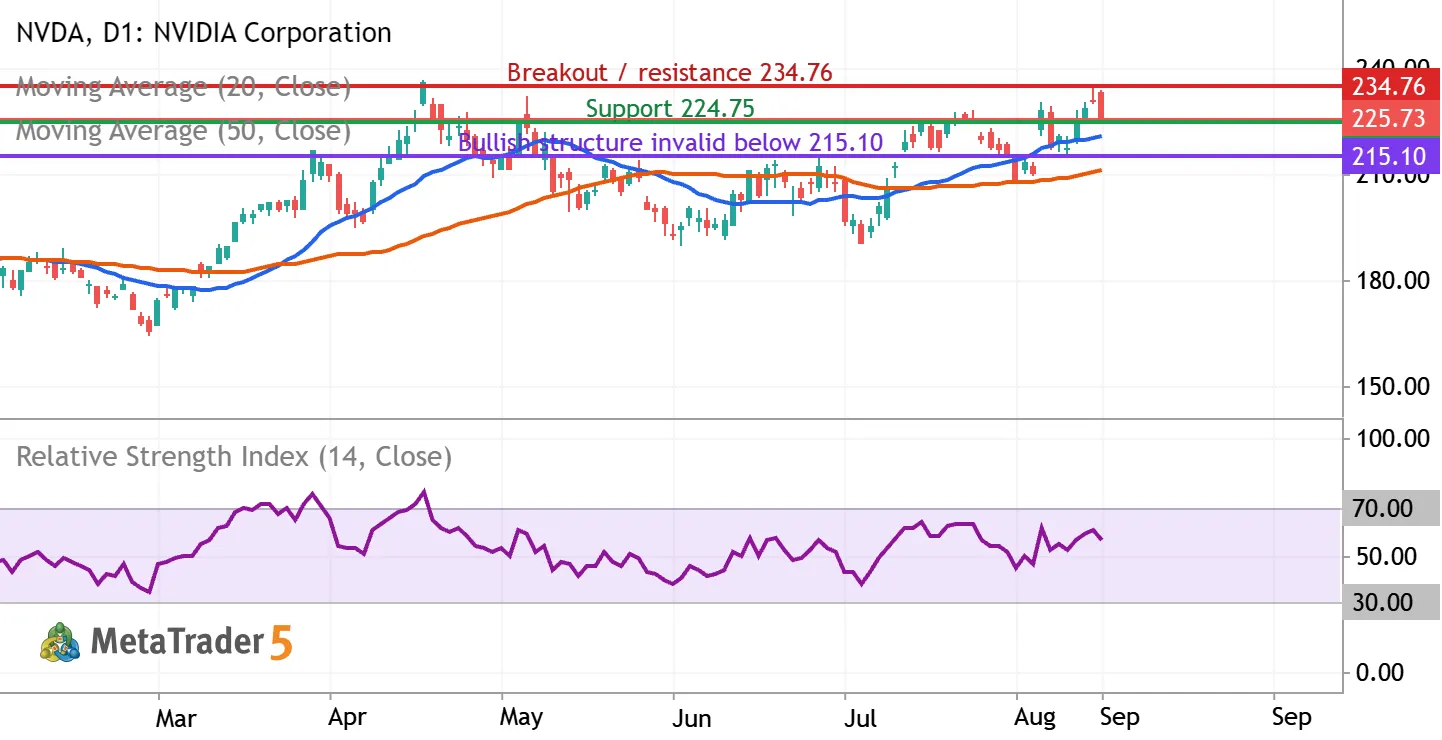
NVDA: testing $225 support as the uptrend meets $234.76 resistance
NVIDIA (NASDAQ: NVDA) | Daily chart | September 9, 2026 Bias: conditionally bullish over the next 2–6 weeks. Entry confirmation is still required. The latest completed regular session, September 8, closed at $225.73, down 2.01%, after reaching $233.71 intraday. The close near the session low signals selling pressure despite the broader recovery. What the indicators show The chart includes a blue 20-day simple moving average, an orange 50-day simple moving average, and purple RSI(14), all calculated from closing prices. At the latest completed candle, MetaTrader showed the averages near $220.48 and $211.22, with RSI near 56.19. Price remains above both rising averages, and the 20-day average is above the 50-day average. RSI above 50 supports positive momentum, but its reading below 70 is


The NVDA doesn’t have other trading ideas at this time
Browse ready-made trading ideas or select a symbol and create your own
Go to Charts and Trading Ideas