

NVDA
#1
NVIDIA Corporation - Common Stock
229.2 8 USD
-0.01%
Market Price
版块: 技术
基础: USD
利润货币: USD
日范围
年范围
日变化
-0.52%
每月变动
+8.62%
6个月变化
+23.26%
年变化
+21.98%
前一天收盘价
230.4 8
Open
233.8 8
最低价
229.1 1
最高价
233.8 9
Financials
值 202020212022202320242025 TTM
新闻
大卫·泰珀曾说过“我不信任自己”来判断英伟达——如今阿帕卢萨持有150万股
罗·卡纳为加州拟议的亿万富翁税辩护,称其为“应对变化中的经济的一种创新性经济解决方案”:“不是阶级战争,也不是惩罚性措施”
超微承包商在25亿美元英伟达AI芯片走私案中认罪
约翰·穆伦纳尔敦促国防部将120所中国学校和技术实验室列入美国研究资助监测名单
英伟达的反弹陷入困境?分析师警告牛市陷阱
今日交易时段出现鲸鱼警报的10只信息技术股票
策略面临“稀释拖累”,因 TD Cowen 将比特币预测上调至 109,000 美元
Snap 股票周五怎么了?
AWS首席执行官表示,人工智能支出“还不是泡沫”——亚马逊云业务负责人称“我们感觉非常好”,而瑞·达利欧警告称这波热潮已接近临界点
独家:MU 股票或将在 24 个月内飙升 190%,并触及 3,000 美元——华尔街多头称这笔账“说实话,挺简单的”
“估值教父”警告:AI 正在耗尽现金流——应对这一转变的 4 种方式
图表与思路
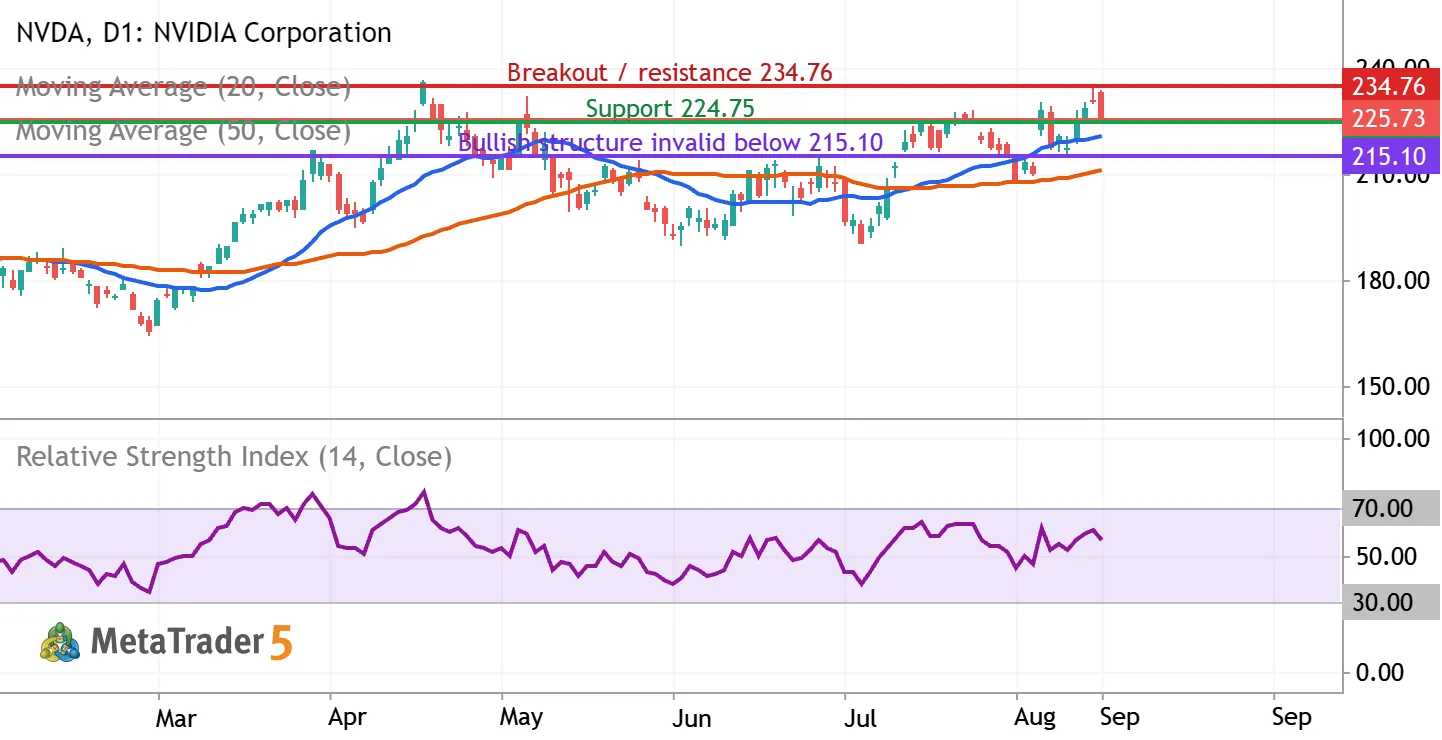
NVDA: testing $225 support as the uptrend meets $234.76 resistance
NVIDIA (NASDAQ: NVDA) | Daily chart | September 9, 2026 Bias: conditionally bullish over the next 2–6 weeks. Entry confirmation is still required. The latest completed regular session, September 8, closed at $225.73, down 2.01%, after reaching $233.71 intraday. The close near the session low signals selling pressure despite the broader recovery. What the indicators show The chart includes a blue 20-day simple moving average, an orange 50-day simple moving average, and purple RSI(14), all calculated from closing prices. At the latest completed candle, MetaTrader showed the averages near $220.48 and $211.22, with RSI near 56.19. Price remains above both rising averages, and the 20-day average is above the 50-day average. RSI above 50 supports positive momentum, but its reading below 70 is


The NVDA doesn’t have other trading ideas at this time
Browse ready-made trading ideas or select a symbol and create your own
Go to Charts and Trading Ideas