

NVDA
#1
NVIDIA Corporation - Common Stock
226.3 2 USD
-0.01%
Market Price
Sector: Technology
Base: USD
Profit Currency: USD
Daily Range
Year Range
Daily Change
-1.29%
Monthly Change
+7.22%
6 month change
+18.60%
Year Change
+22.48%
Previous Close
229.2 8
Open
228.7 3
Low
224.9 2
High
228.8 6
Financials
Value 202020212022202320242025 TTM
News
David Sacks Reiterates: The Best Party to Prevent One's Own Model from Being Distilled Is the Enterprise, Not the Government
Mastercard Surges Near 2026 High, Leads 10 Hot Prospects To Best Stock Lists
Frenzied Stock-Options Trading Shows Individual Investors Are Still Hungry for Risk
Nvidia and AMD shares fall as new AI announcements fail to re-energize investors
The Line That Could Pop the AI Bubble
Dow Jones Futures: Micron, Nvidia Lead AI Trade Lower; Apple, Meta Rally Near Buy Points
Nvidia (NVDA) Sees a More Significant Dip Than Broader Market: Some Facts to Know
Navitas Semiconductor Stock Rises After Hours: Here's Why
3 Best ETFs to Bank on for an 11% Gain, According to AI Analyst - TipRanks.com
Navitas Semiconductor Announces 24 Kilowatts, 800 Volts To 12 12 V DC-DC GaNFast-Powered Power Delivery Board Developed In Partnership With Nvidia
Stock Market Today: S&P 500 Bull Market Turns Four Years Old ahead of Big Bank Earnings - TipRanks.com
Charts & Ideas
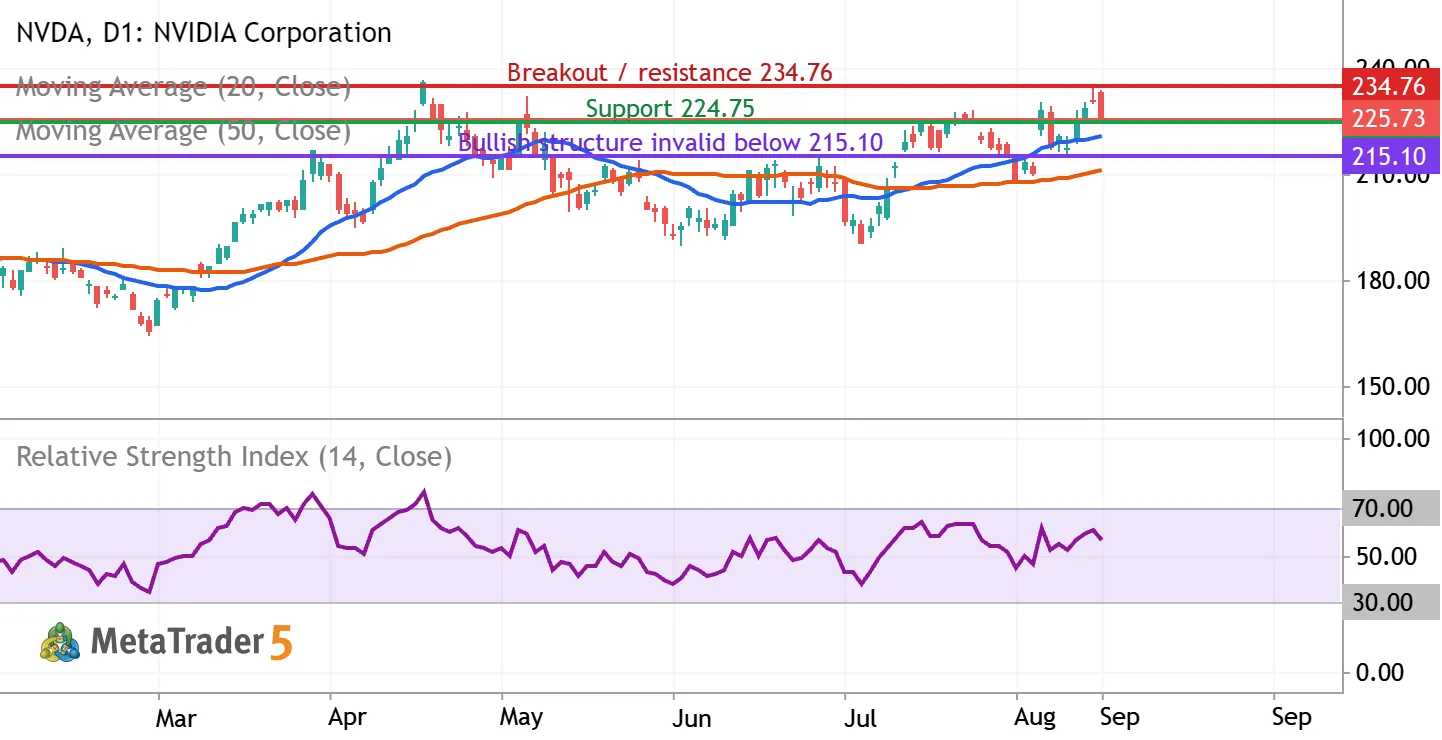
NVDA: testing $225 support as the uptrend meets $234.76 resistance
NVIDIA (NASDAQ: NVDA) | Daily chart | September 9, 2026 Bias: conditionally bullish over the next 2–6 weeks. Entry confirmation is still required. The latest completed regular session, September 8, closed at $225.73, down 2.01%, after reaching $233.71 intraday. The close near the session low signals selling pressure despite the broader recovery. What the indicators show The chart includes a blue 20-day simple moving average, an orange 50-day simple moving average, and purple RSI(14), all calculated from closing prices. At the latest completed candle, MetaTrader showed the averages near $220.48 and $211.22, with RSI near 56.19. Price remains above both rising averages, and the 20-day average is above the 50-day average. RSI above 50 supports positive momentum, but its reading below 70 is


The NVDA doesn’t have other trading ideas at this time
Browse ready-made trading ideas or select a symbol and create your own
Go to Charts and Trading Ideas