QQQ - Technical Analysis 2026 QQQ Invesco QQQ Trust, Series 1

QQQ - Technical Analysis 2026

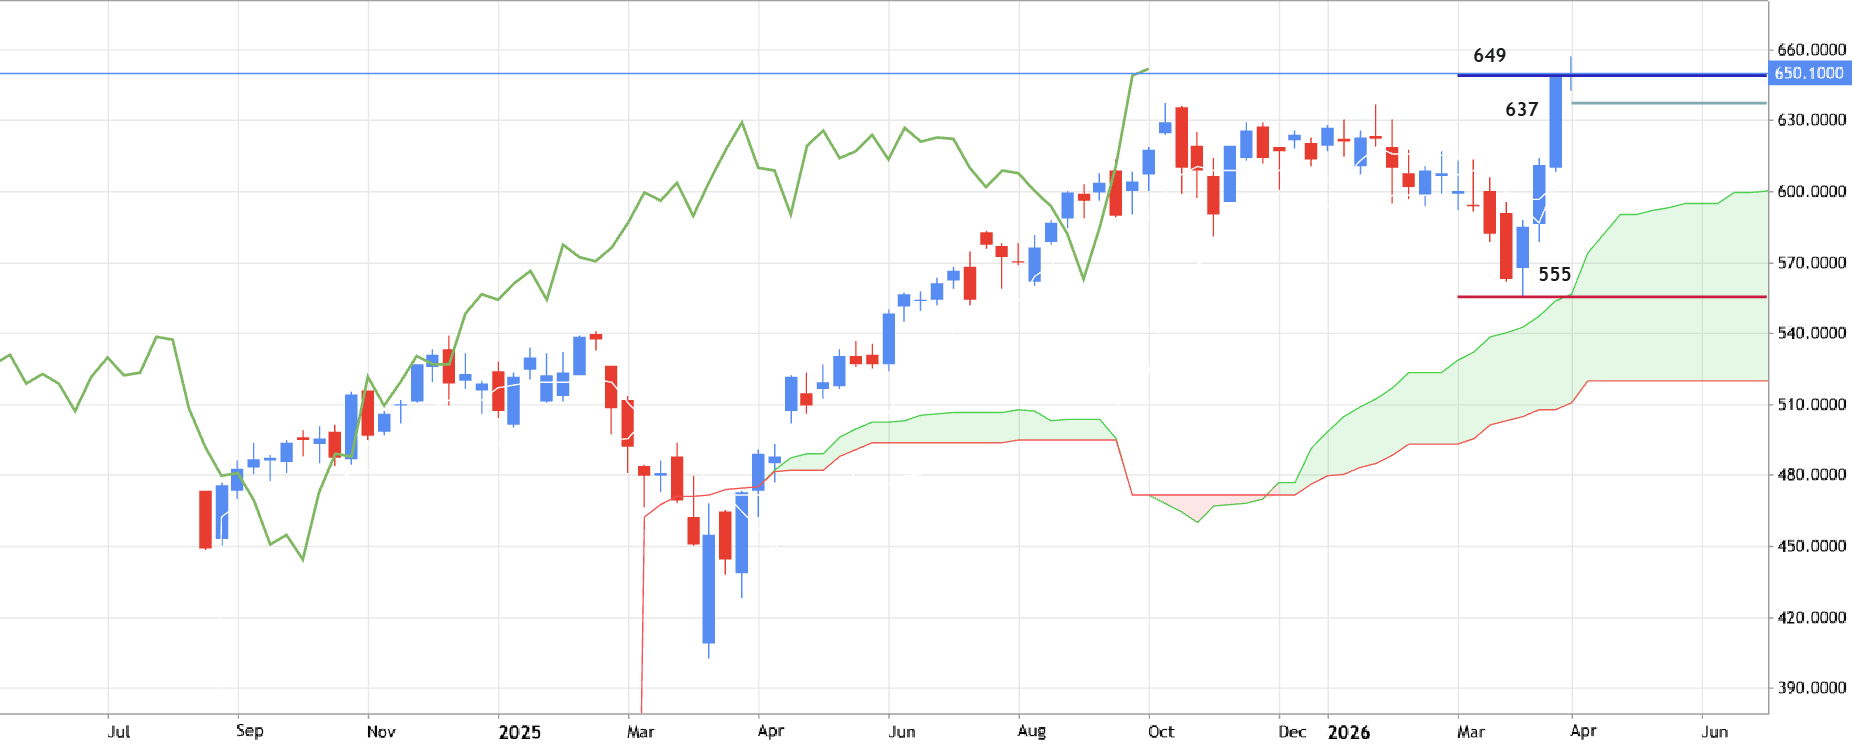
Weekly price is trying to break the resistance level at 649 to above for the strong bullish breakout to be continuing. The Chinkou Span line of Ichimoku indicator is crossed the historical price to above indicating the breakout to be continuing in the near future. If the price breaks support level at 637 to below so the secondary correction will be started; if the price crosses the support at 555 so the primary weekly bearish reversal may be started in the secondary ranging way; if the price breaks 649 resistance level on weekly close bar so the strong bullish breakout may be continuing. Trading Summary : watch the price to be crossed with the levels for possible buy or sell trades on the lower timeframes for example.

EQAL - Long-Term Technical Forecast and Levels EQAL Invesco Russell 1000 Equal Weight ETF

EQAL - Long-Term Technical Forecast and Levels

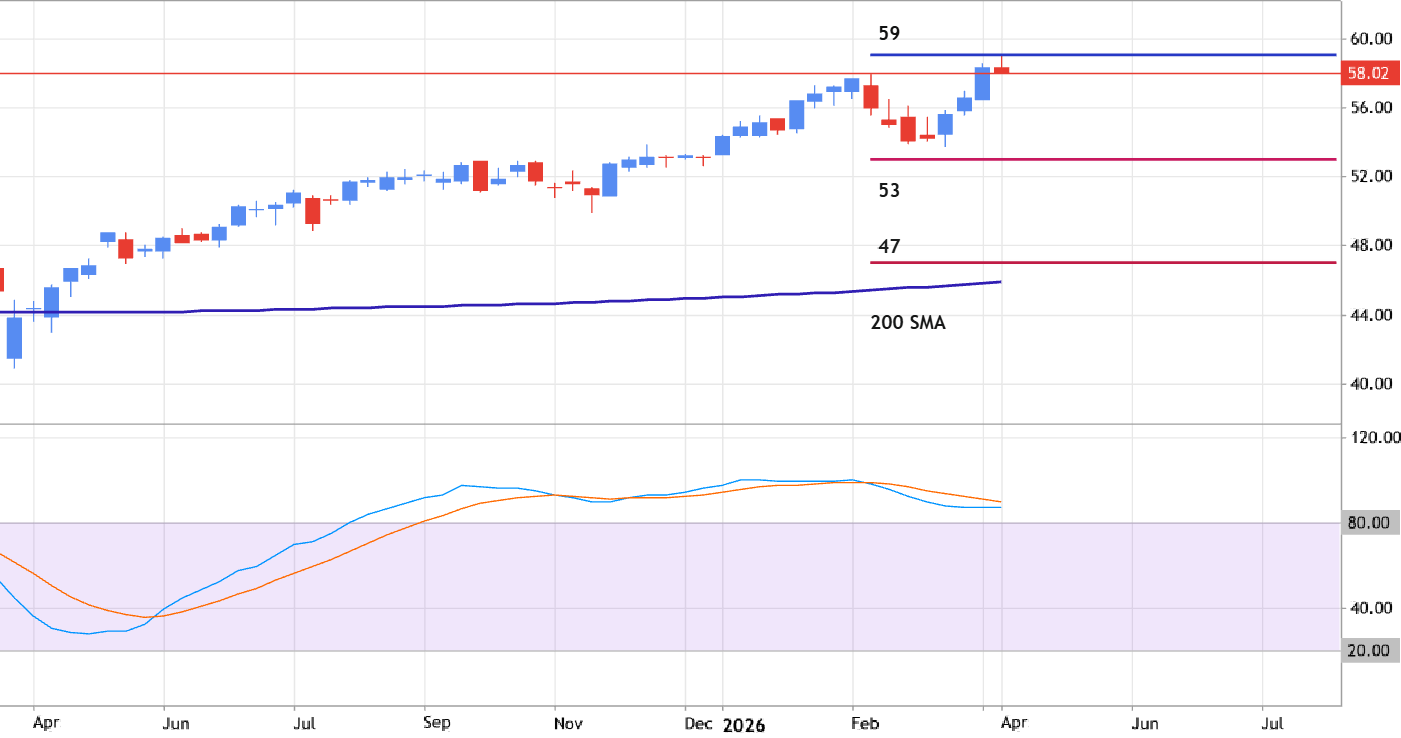
Weekly price is located above 200 SMA for trying to break the resistance level at 59 to above for the strong bullish trend to be continuing. The price is within 53/59 s/r channel for the secondary correction to be started with 47 level as the possible re-enter target for the bearish reversal or for the bullish trend to be continuing with the resistance lebel at 59 to be broken above. The Stochastic oscillator is on overbought condition indicating the secondary correction to be started in the near future. Trading Summary: waiting for the levels to be crossed on close weekly bar for possible direction in lower/intra-day chart for example.
GLDI - Trading Ideas for 2026 GLDI ETRACS Gold Shares Covered Call ETNs due February 2, 2033

GLDI - Trading Ideas for 2026

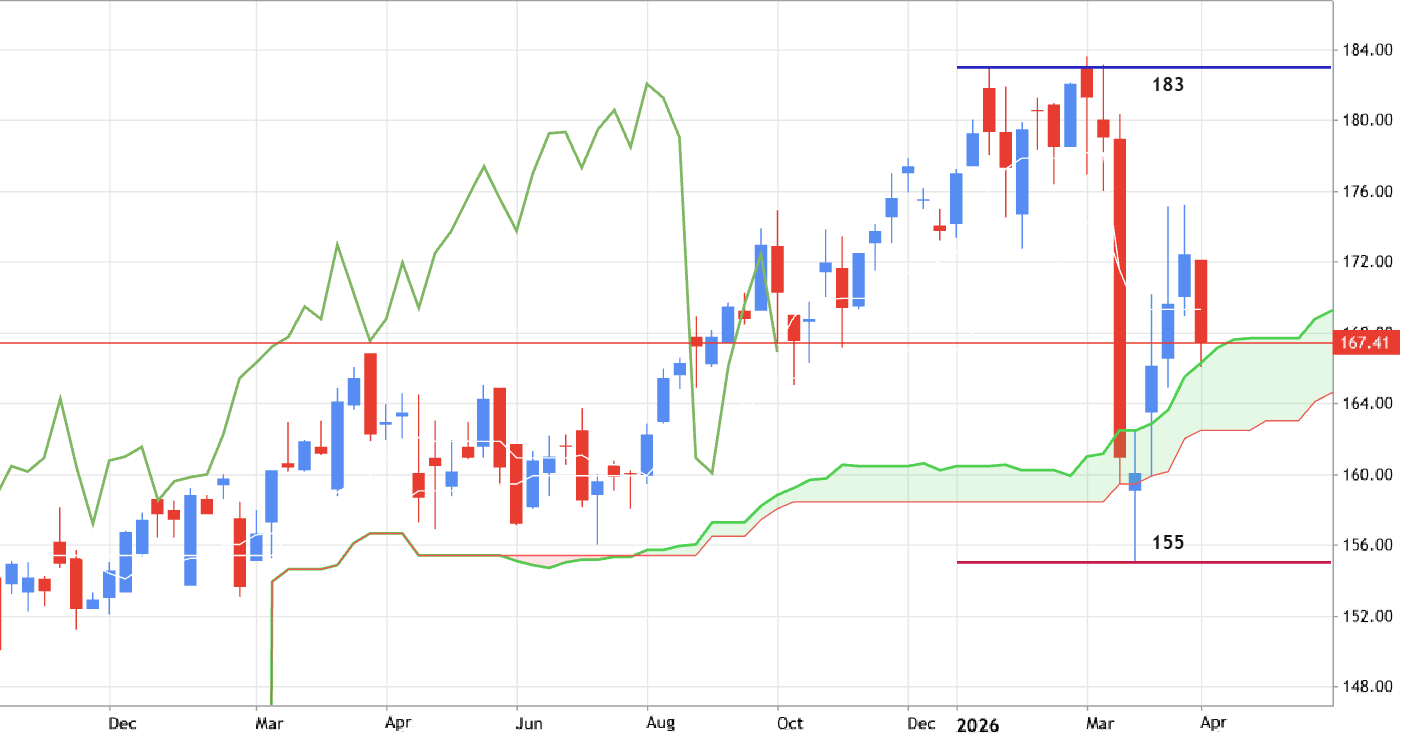
Weekly price is located above Ichimoku loud for ranging within 155/183 s/r channel waiting for the direction of the strong trend to be resumed or for the primary bearish reversal to be started. - if the price crosses resistance level at 183 so the strong bullish trend will be resumed; - if the price breaks 155 support to below so the bearish reversal will be started; - alternatively, the price will be on secondary ranging within the primary bullish waiting for direction. Trading Summary: watch the price to be crossed s/r levels on close weekly bar.
SHEL - Long-Term Forecast SHEL Shell PLC American Depositary Shares (each representing two (2)

SHEL - Long-Term Forecast

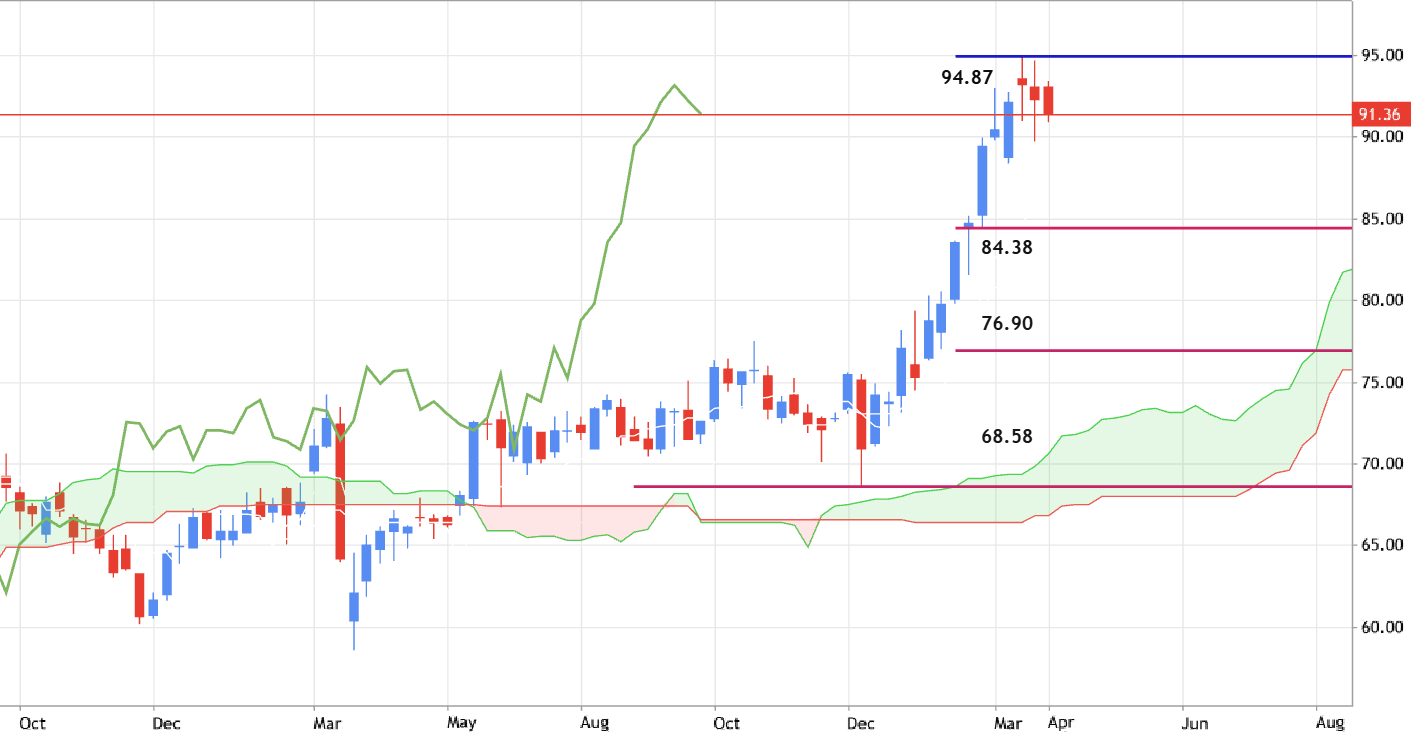
Weekly price is located above Ichimoku cloud in the bullish area of the chart. The price was bounced from the resistance level at 94.87 for the ranging market condition. - If the price breaks the support level at 84.38 to below so the secondary correction within the primary bullish trend will be started; - if the price crosses 76.90 support to below so the primary bearish reversal may be started with 68.58 level to re-enter; - if the price breaks 94.87 resistance to above so the strong bullish trend will be continuing; - alternatively, the price will be on ranging within s/r channel waiting for the direction of the strong trend. Trading Summary : waiting for direction
ENB - Long-Term Forecast ENB Enbridge Inc Common Stock

ENB - Long-Term Forecast

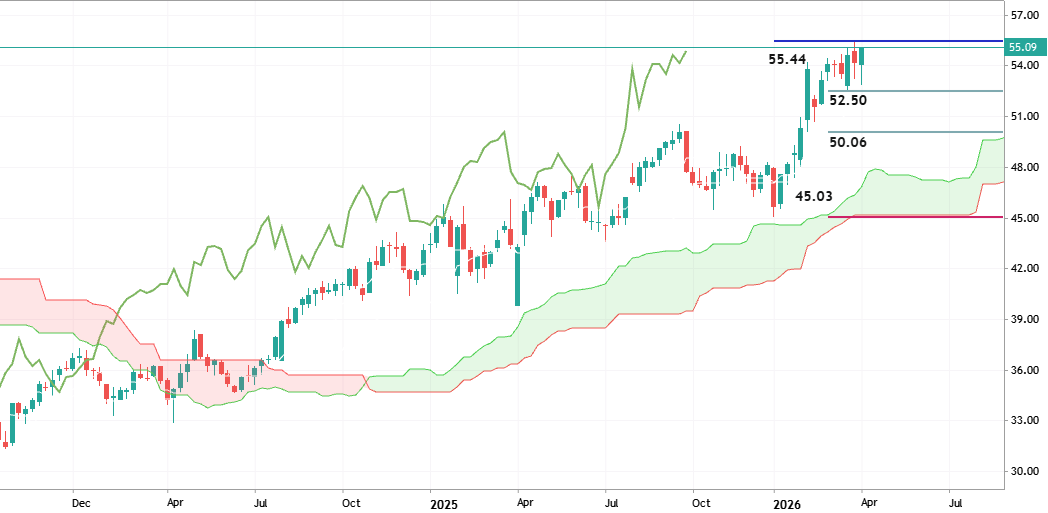
Weekly price is located far above Ichimoku cloud in the bullish area of the chart. The price is testing the resistance level at 55.44 to above for the strong bullish trend to be continuing. The alternative scenarios are the following: - if the price breaks the support at 52.50 to below so the secondary correction may be started with 50.06 possible target to re-enter; - if the weekly price crosses 50.06 support level so the correction will be continuing with 45.03 bearish reversal level; - if not so the price will be on ranging within s/r channel waiting for the direction of the strong trend to be started. Summary : primary bullish continuation
TRP - Long-Term Forecast TRP TC Energy Corporation Common Stock

TRP - Long-Term Forecast

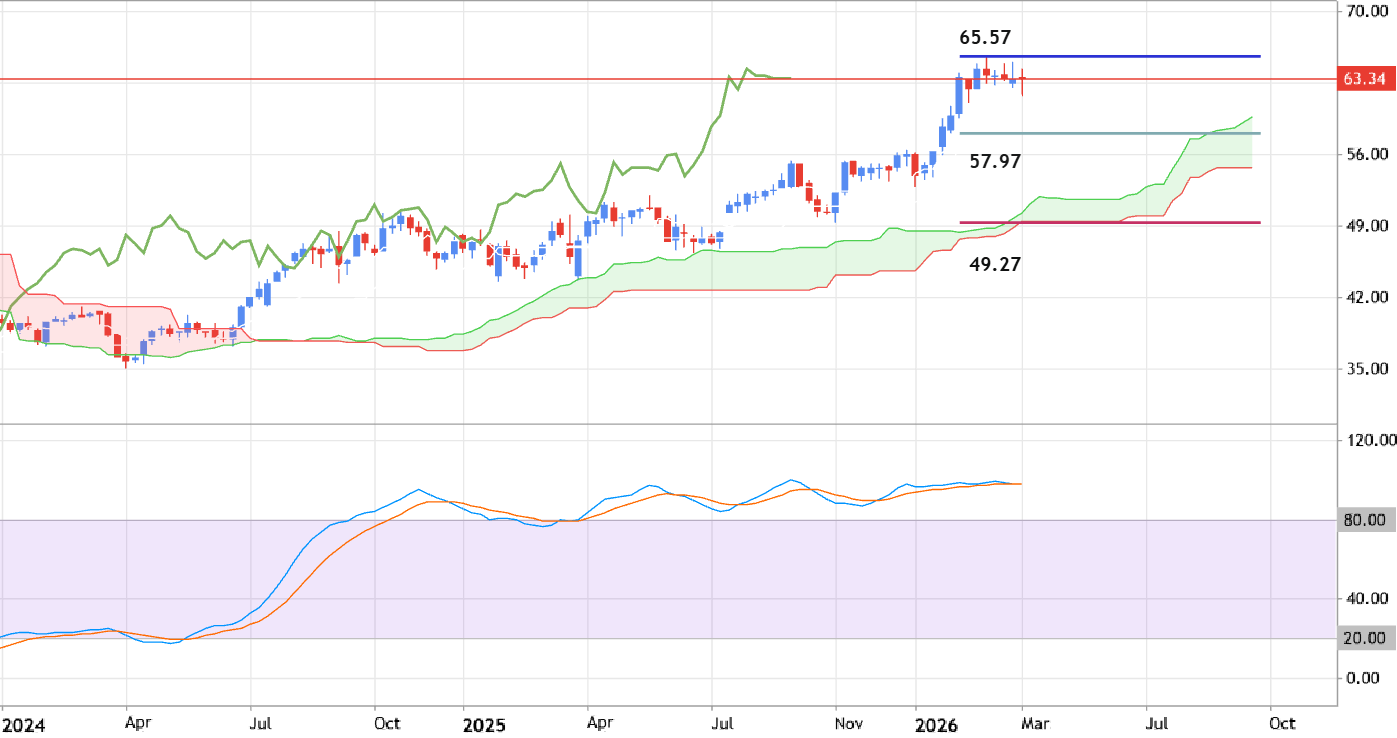
Weekly price is located above Ichimoku cloud in the bullish area of the chart. The price is trying to test the resistance level at 65.57 to above for the primary weekly bullish trend to be continuing. But Stochastic oscillator is indicating the overbought market condition for the price by now, and the nearest support level at 62.38 is the easy to be broken now for example. If the price breaks 65.57 resistance to above so the strong bullish trend will be continuing. If the price crosses 57.97 support to below so the secondary correction within the primary bullish trend will be started with 49.27 level as the weekly bearish reversal target. Alternatively, the price will be on secondary ranging within 57.97/65.57 s/r levels waiting for direction. Trading Summary: ranging within support/resistance channel waiting for direction of the strong trend to be started.
USDZAR - Price Action Daily Analysis USDZAR US Dollar vs Rand

USDZAR - Price Action Daily Analysis

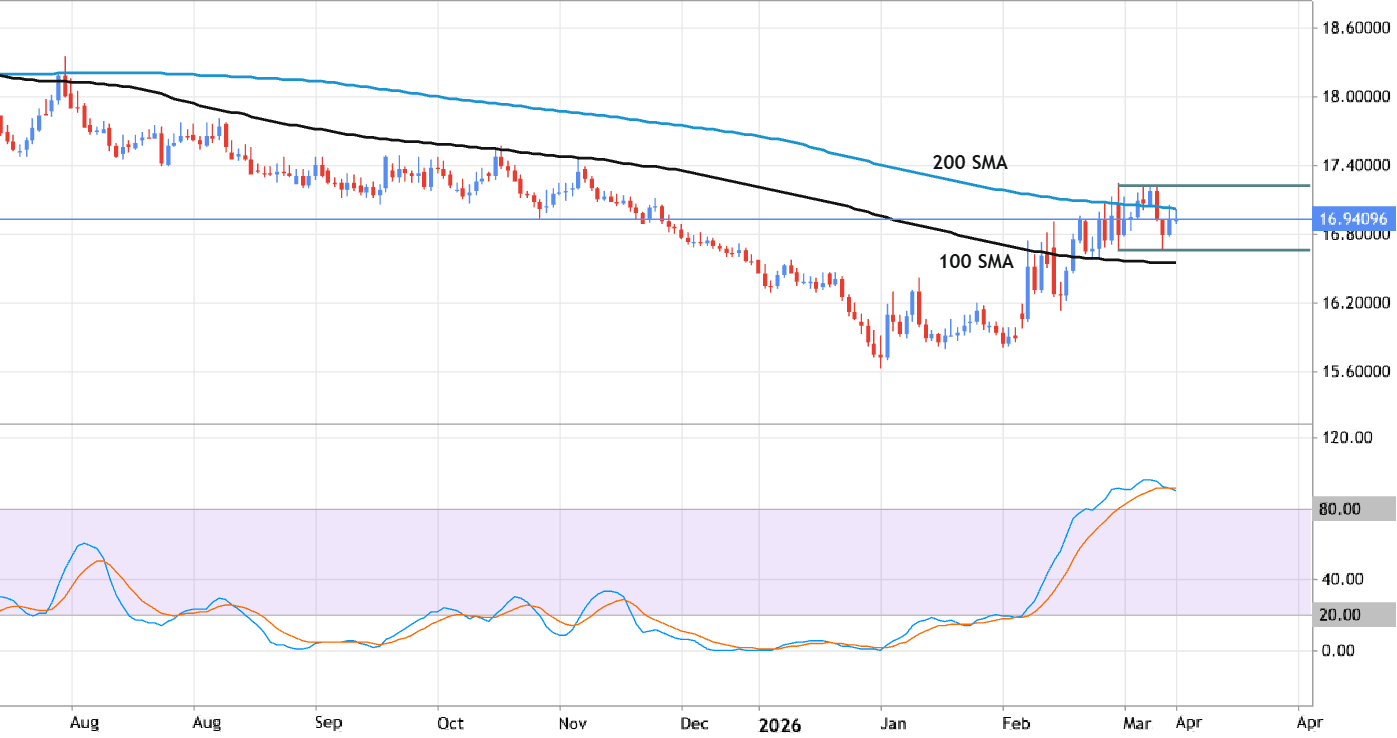
Daily price is on ranging around 200 SMA within 16.66/17.22 s/r channel waiting for the direction, and the Stochastic oscillator is indicating the overbought market condition. If the price breaks support level at 16.66 to below so the primary daily bearish trend will be resumed. If the price crosses 17.22 resistance level to above so the primary daily bullish reversal will be started. Alternatively, the price will be on ranging waiting for direction of the strong trend to be started. Recommendation: waiting for direction