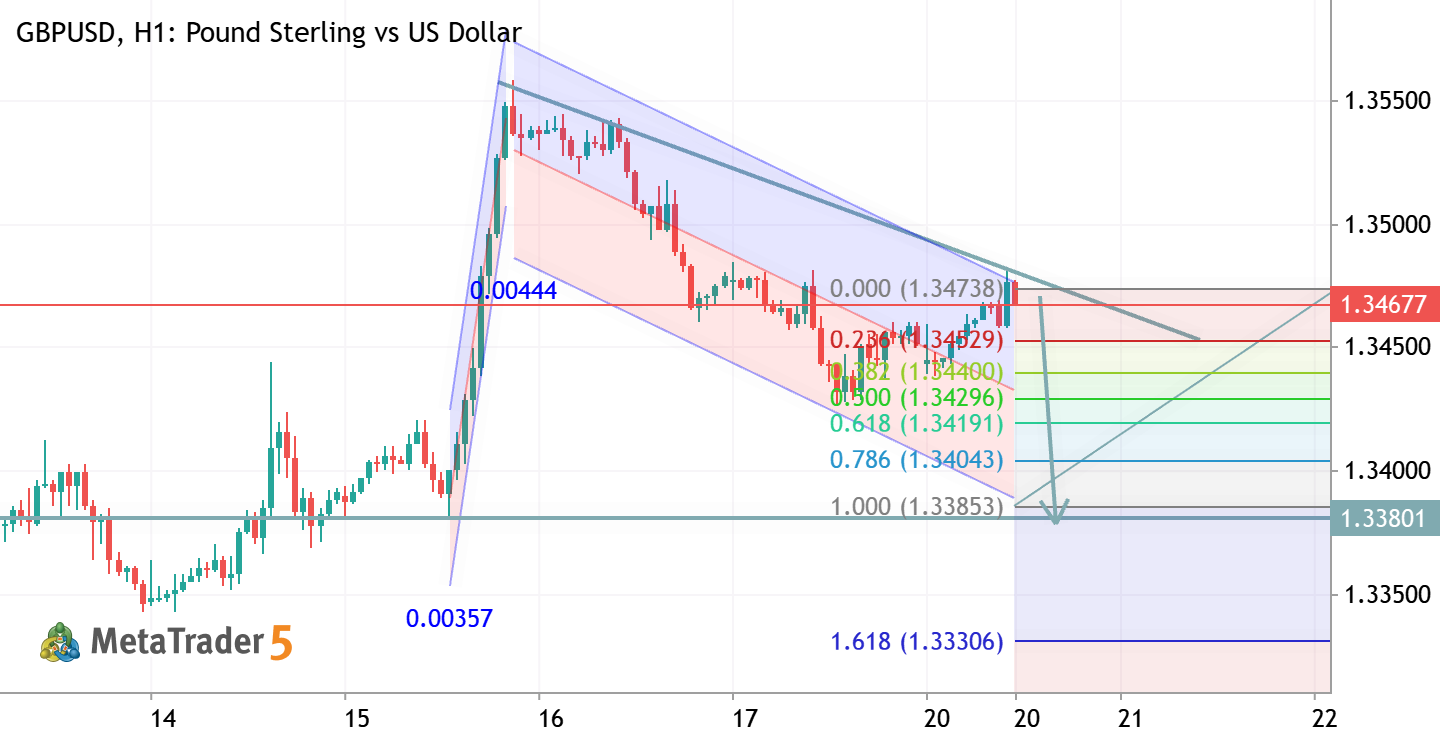
XAUUSD D1 - Teste de Confluência em Suporte Crítico e Retração de Fibonacci XAUUSD Gold vs US Dollar
XAUUSD D1 - Teste de Confluência em Suporte Crítico e Retração de Fibonacci
O gráfico diário do XAUUSD (Ouro) apresenta um cenário de correção técnica significativa após o preço ter atingido a região de topo histórico em 5600. Atualmente, o ativo está testando a zona de suporte horizontal em 4497.96 (marcada pela linha verde), que se tornou o ponto focal da ação do preço nas últimas sessões. Confluências: Este nível de preço é de extrema relevância devido à convergência de múltiplos fatores técnicos: 1.Suporte Horizontal: A linha verde em 4497.96 já atuou como resistência e suporte anteriormente, demonstrando memória de mercado. 2.Retrações de Fibonacci: O preço está interagindo com os níveis de Fibonacci plotados (linhas laranjas), sugerindo que a correção atingiu uma zona onde compradores historicamente buscam valor. 3.Linha de Tendência de Alta (LTA): A
0
Righetti_sa Frequencia Do Mercado 2026.05.28 21:13
PFE - Daily Trading Forecast PFE Pfizer, Inc. Common Stock
PFE - Daily Trading Forecast
Daily price was bounced from support level at 25.19 to above for 200 SMA to be crossed for the bullish trend to be resumed. Stochastic oscillator is showing the oversold market condition for the price, and Parabolic SAR is on uptrend for the price to be started so the bullish trend continuation is very likely for D1 price for example. if the price breaks 26.54 resistance level to above for the 27.85 possible target so the primary bullish trend will be resumed; If the price crosses support level at 25.19 to below so the bearish reversal will be started with 24.83 as the target to re-enter; alternatively, the price will be on secondary ranging to be near 200 SMA waiting for the direction of the strong trend to be started. Trading Summary : ranging for direction
1
newdigital Sergey Golubev 2026.05.28 16:32
XAUUSD TRADE IDEA XAUUSD Long Gold vs US Dollar
XAUUSD TRADE IDEA
Gold is showing a strong bearish H4 structure after breaking below the 4455 support zone. Price reacted from the marked resistance area around 4550 and continued lower with momentum selling. Current market structure suggests sellers remain in control unless price reclaims 4455–4460. The sharp rejection near 4393 indicates temporary buyer interest, but overall trend pressure is still bearish. Key Levels: Resistance: 4455 → 4550 Support: 4393 → 4353 Trading Outlook: Bearish continuation below 4455 could push price toward 4393 and 4353 support. A confirmed breakout above 4455 may trigger a short-term retracement toward 4500–4550. Professional Bias: Main trend: Bearish Intraday bias: Sell on pullbacks Confirmation needed: Candle rejection or breakout retest before entry.
3
HamadJatoi Hamad Jatoi 2026.05.28 08:22
BTCUSD TRADE IDEA BTCUSD Bitcoin vs US Dollar
BTCUSD TRADE IDEA
BTCUSD is trading near a major H4 support zone around 74,900 – 75,400 after a strong bearish breakdown from the 77,300 resistance area. The chart shows price rejecting multiple supply zones and losing bullish momentum, confirming short-term bearish pressure. The current move is testing a key ascending trendline support. A clean break below 74,900 could trigger a continuation sell-off toward 72,900 , followed by the major support around 70,400 . This area also aligns with the lower Fibonacci retracement zone, making it an important target for sellers. On the upside, if BTC holds above the trendline and reclaims 77,300 , buyers may attempt a recovery toward 78,800 – 79,500 resistance. However, overall structure remains weak unless price closes back above the upper supply zone. Key Levels
3
HamadJatoi Hamad Jatoi 2026.05.27 19:58
CVX - Daily Trading Forecast CVX Short Chevron Corporation Common Stock
CVX - Daily Trading Forecast
Daily price broke Ichimoku cloud to below for the primary daily bearish reversal. Chinkou Span line of Ichimoku indicator is crossing the historical price to below for the good bearish breakdown but Stochastic oscillator is indicating the possible rally in the near future. If the price breaks support level at 177.7 to below with 162.9 level as a possible target so the bearish trend will be continuing. If the price crosses resistance level at 198.8 to above with 214.7 level as a possible target so the bullish reversal will be started. Alternatively, the price will be on secondary ranging waiting for direction. Trading Summary : daily bearish reversal; watch the s/r levels for the next direction
1
newdigital Sergey Golubev 2026.05.27 17:43
BTCUSD TRADE IDEA BTCUSD Short Bitcoin vs US Dollar
BTCUSD TRADE IDEA
BTCUSD is currently trading inside a short-term consolidation range after a strong bearish correction from the 81K resistance zone. Price reacted sharply from the supply area near 79,000–80,000 and dropped toward the key support around 75,500. The market structure on H4 remains bearish-to-neutral while price stays below the 77,850 resistance zone. Multiple rejections from this level show weak bullish momentum and possible continuation to the downside. Key Levels: Resistance: 77,850 → 80,600 Support: 75,500 Bearish Scenario: If BTCUSD fails to break and close above 77,850, sellers may push price back toward 75,500 support. A breakdown below 75,500 could open the path toward 74,000 and lower. Bullish Scenario: A strong H4 close above 77,850 may trigger recovery momentum toward 79,000 and
0
HamadJatoi Hamad Jatoi 2026.05.25 19:35
GBPUSD TRADE IDEA GBPUSD Long Pound Sterling vs US Dollar
GBPUSD TRADE IDEA
strong bullish recovery after the sharp selloff toward the 1.3310 zone. Price has formed an ascending structure with higher lows, and buyers are now testing a key resistance area around 1.3490–1.3505. The current breakout attempt above the consolidation range suggests bullish momentum is increasing. If buyers maintain control above 1.3500, the next upside targets are: 1.3545 1.3590 1.3630 The drawn projection on the chart also supports a continuation toward the upper resistance zone near 1.3600+. Immediate support levels: 1.3450 1.3435 1.3400 A rejection below 1.3450 could trigger another pullback toward the lower demand area before continuation. Market structure remains short-term bullish while price holds above the rising trendline and breakout zone. Momentum traders may look for buy
0
HamadJatoi Hamad Jatoi 2026.05.25 13:39
XAUUSD TRADE IDEA XAUUSD Long Gold vs US Dollar
XAUUSD TRADE IDEA
Gold is currently trading inside a short-term recovery structure after holding the 4500–4510 demand zone. Price successfully defended support multiple times and is now attempting a bullish continuation toward the next resistance area. Key Levels Resistance: 4607 → 4675 → 4705 Support: 4545 → 4510 → 4490 Market Structure Overall trend remains bullish on the higher timeframe, but price is still moving inside a corrective range. Buyers regained momentum after repeated rejections from the 4500 zone. Current consolidation near 4565 suggests accumulation before a possible breakout higher. Bullish Scenario If price holds above 4545 and breaks 4607 with strong momentum, the next upside targets are: 4675 4705 A clean breakout above 4607 could trigger continuation buying pressure. Bearish Scenario
0
HamadJatoi Hamad Jatoi 2026.05.25 13:04