
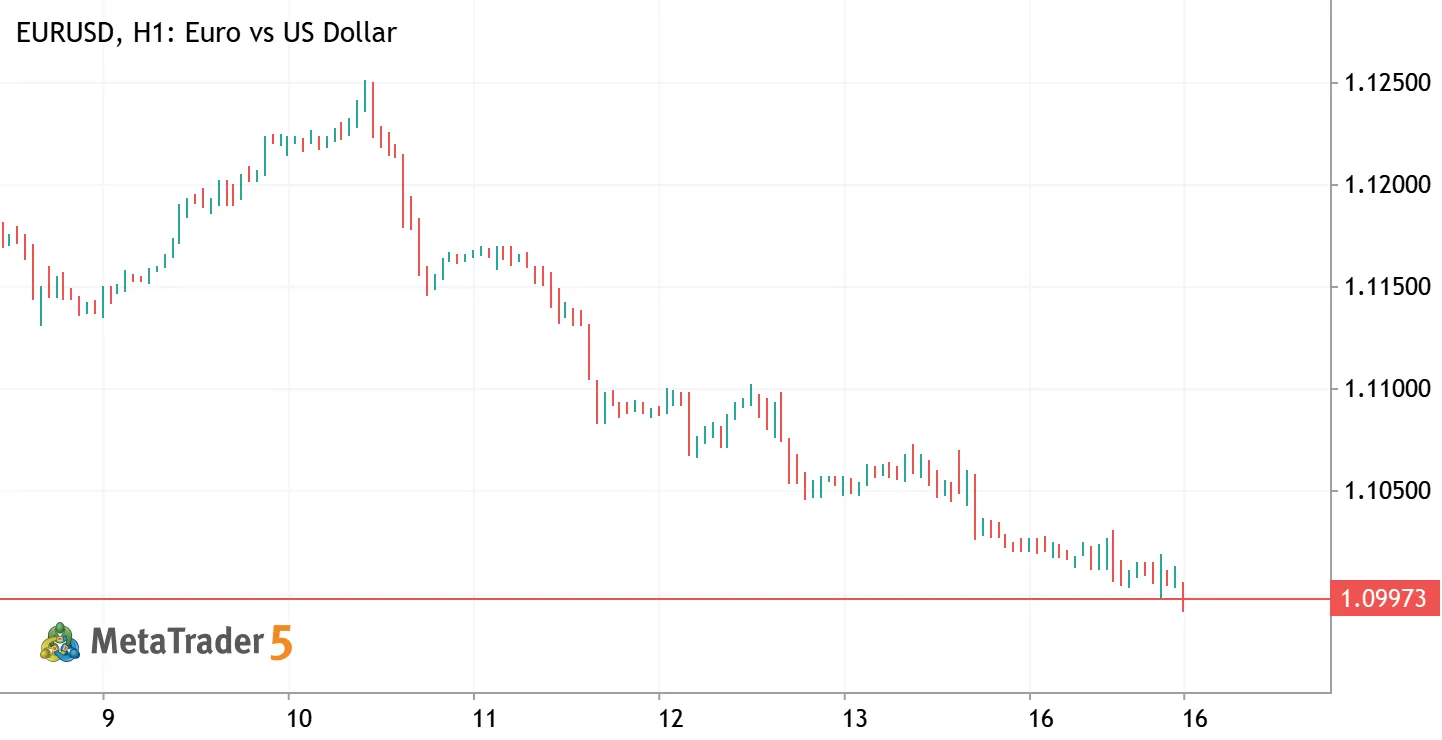
EDUCATIONAL EURUSD H1 EXAMPLE — NOT A LIVE TRADE SIGNAL A 2:1 reward-to-risk plan can be attractive on a chart, yet the amount a trader may actually make relative to the amount at risk is often smaller once the costs of execution are included. The EURUSD H1 chart attached to this idea provides market context. The exact entry, stop and target distances below are hypothetical: they are not levels selected from this live chart, and neither the chart nor the True Trading Cost indicator is issuing a BUY recommendation. THE PLANNING SCENARIO Imagine a hypothetical EURUSD buy plan in a USD account: • Entry: 1.10000 at Ask (illustrative). • Stop exit: 1.09750 at Bid — 25 pips away. • Target exit: 1.10500 at Bid — 50 pips away. • Position: 1 standard lot, assuming $10 per pip. Before separate fees, this is $250 of gross risk against $500 of gross potential reward — the familiar 2:1. Now include the costs that are easy to overlook: • Round-trip commission: $7 per lot. • Other fees: $1 per lot. • Assumed execution slippage: 0.2 pip, or $2 per lot. • Swap: $0 in this intraday example. Total modeled add-on cost: $10 per lot. Net risk becomes $250 + $10 = $260, while net reward becomes $500 - $10 = $490. The new reward-to-risk ratio is $490 / $260 = about 1.88:1, not 2:1. Important: the entry is modeled at Ask and exits at Bid. This executable-price difference already accounts for spread, so the spread should not be deducted a second time. Broker-specific slippage and commission still have to be verified. THE POSITION-SIZE FILTER Suppose the account equity is $10,000 and the maximum risk budget is 1% ($100). At an estimated $260 risk per lot, the theoretical maximum is $100 / $260 = 0.3846 lot. With a broker's 0.01-lot volume step, rounding DOWN gives 0.38 lot, with modeled risk of $98.80. Actual lot limits and tick values must be checked with the broker. WHEN TO PASS ON THE IDEA There is no trade unless a separate market-structure method justifies the entry, stop and target. Even then, reject or resize the plan when costs weaken the net R:R, when risk would exceed the budget, when the stop distance is unacceptable, or when live broker quote/tick-value data is stale or missing. If a position may remain open overnight, check the broker's swap schedule and financing costs too. HOW THE INDICATOR HELPS True Trading Cost & Net Risk/Reward for MT4 and MT5 is a free, source-available chart PLANNER. Traders can drag Entry, Stop and Target lines, compare gross and net risk/reward, estimate break-even and risk-based lot size, and optionally consider swap and spread observations. Its BUY/SELL buttons only change the simulated planning direction; it does not place trades. The indicator is not displayed inside this MetaTrader.com web chart. It runs on the MT4/MT5 desktop terminal. The calculations above are illustrative, not a recorded broker execution or a prediction. Further reading and free source: • Full English walkthrough: https://forexreview.top/2026/11/15/true-trading-cost-net-risk-reward-mt4-mt5 • Free MT5 indicator: https://www.mql5.com/en/code/79598 • Free MT4 indicator: https://www.mql5.com/en/code/79600 • Indonesian illustrated guide: https://dasarforex.top/true-trading-cost-mt4-mt5-cara-pakai-net-risk-reward/ Educational analysis only. Forex and CFD trading involves risk; hypothetical outcomes do not predict future results.
0

 Perfil no MQL5
Related publications








Disclaimer:
The information provided does not constitute financial, investment, trading, or other advice or recommendations by MetaQuotes. See the Terms of Use for details.
Novo comentário