
SHIP
#3309
Seanergy Maritime Holdings Corp. - Common Stock
14.9 1 USD
+0.01%
Setor: Indústria
Base: USD
Moeda do lucro: USD
Faixa diária
Faixa anual
Mudança diária
+0.81%
Mudança mensal
-10.18%
Mudança em 6 meses
+58.28%
Mudança anual
+120.89%
Fechamento anterior
14.7 9
Open
14.7 7
Mínimo
14.7 6
High
14.9 1
Volume
75
Financials
Valor 202020212022202320242025 Current
Key stats
Valuation ratios
Profitability ratios
Liquidity ratios
Solvency ratios
Per share metrics
Notícias
Seanergy Maritime registra crescimento robusto no 1º tri de 2026
Indonésia - Ações fecharam o pregão em queda e o Índice IDX Composite recuou 0,91%
Indonésia - Ações fecharam o pregão em queda e o Índice IDX Composite recuou 0,85%
Tufton Oceanic Assets reporta queda na receita em meio à manutenção de navios
Seanergy encomenda dois navios japoneses e vende embarcação mais antiga
Ações da United Maritime sobem com transações estratégicas de ativos
Seanergy Maritime registra forte alta nas ações no 4º tri de 2025
Preço-alvo das ações da Seanergy Maritime elevado para US$ 17 pela Noble Capital
Indonésia - Ações fecharam o pregão em alta e o Índice IDX Composite avançou 0,71%
Seanergy Maritime vende navio capesize por US$ 21,6 milhões
Indonésia - Ações fecharam o pregão em alta e o Índice IDX Composite avançou 0,10%
Gráficos e ideias
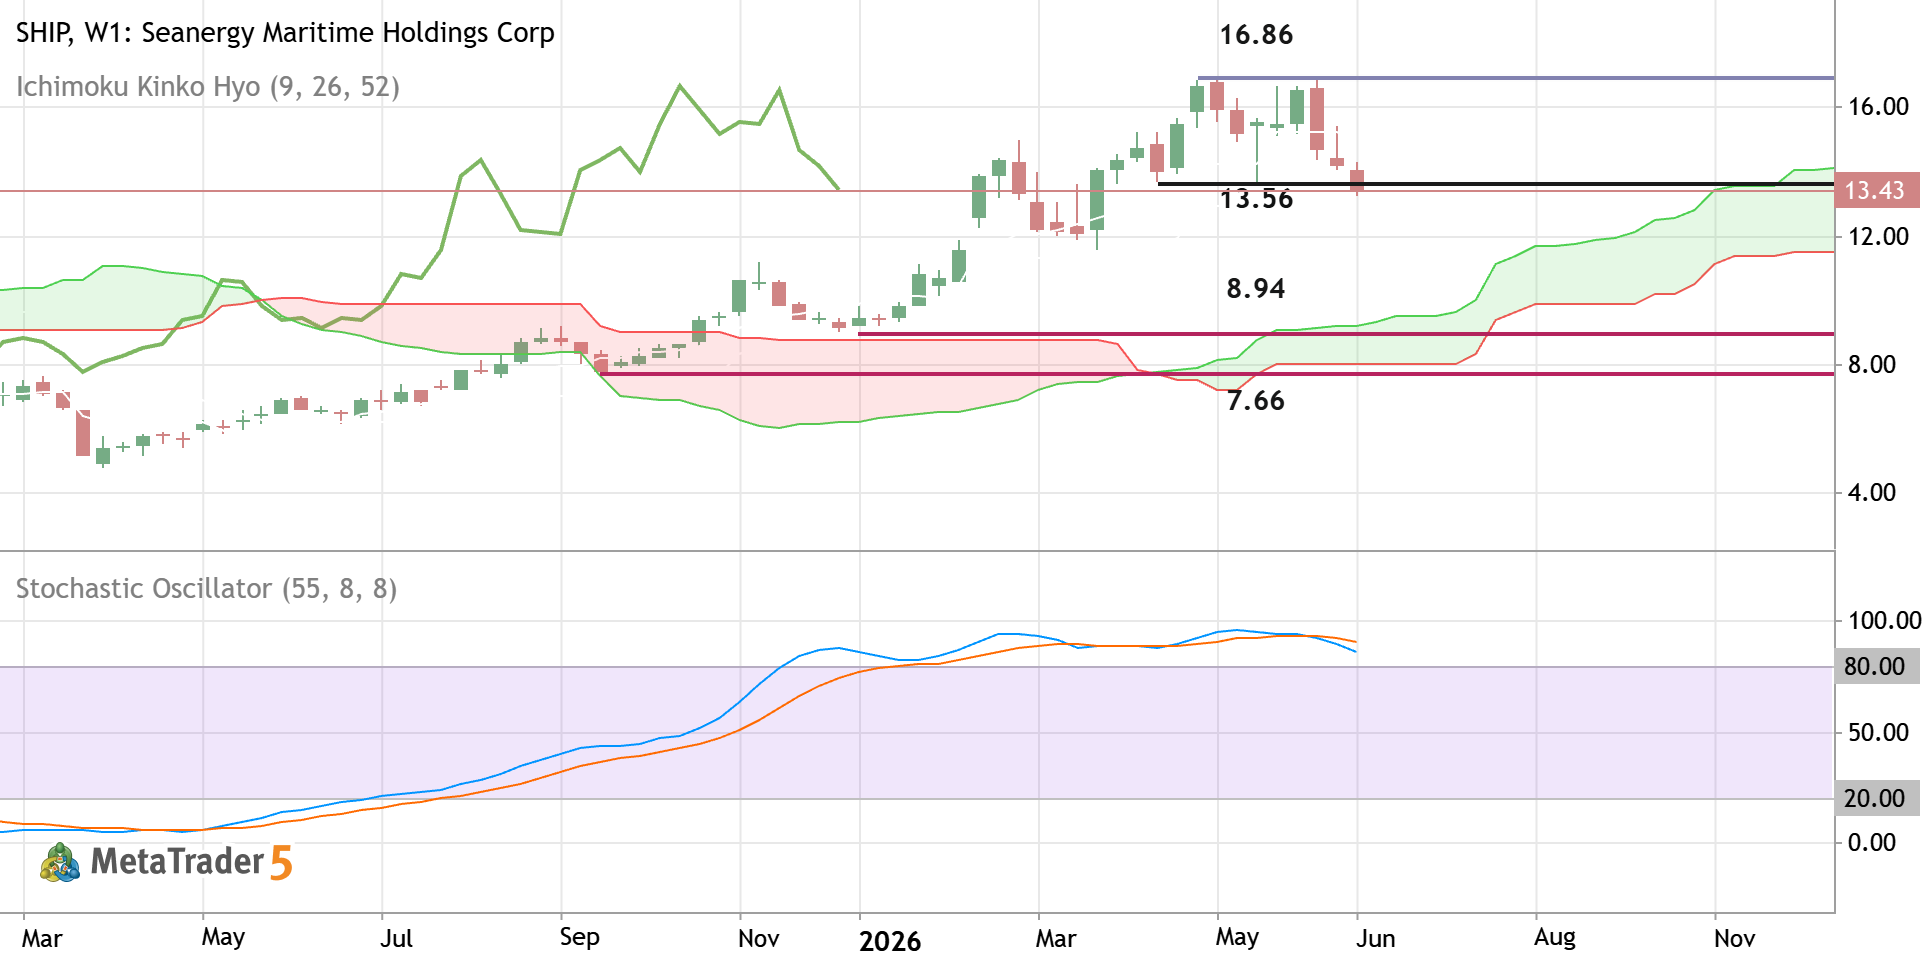
SHIP - Long-Term Technical Forecast
The weekly price is located above Ichimoku cloud in the bullish area of the chart. The price was bounced from support level at 16.86 to below for trying to break the next support level at 13.56 for the secondary correction to be started. If the price breaks the level at 13.56 to below on weekly close bar so we may see the secondary correction within the primary bullish market condition. If the price crosses 8.94 support to below together with the next support level at 7.66 so the primary bearish reversal will be started. Alternatively, the price will be on ranging to be near and above Ichimoku cloud waiting for the direction of the strong trend to be started. Trading Summary : ranging to the secondary correction
0 

The SHIP doesn’t have other trading ideas at this time
Browse ready-made trading ideas or select a symbol and create your own
Go to Charts and Trading Ideas