
SHIP
#3308
Seanergy Maritime Holdings Corp. - Common Stock
14.7 9 USD
-0.01%
Sector: Industrials
Base: USD
Profit Currency: USD
Daily Range
Year Range
Daily Change
-1.14%
Monthly Change
-10.90%
6 month change
+57.01%
Year Change
+119.11%
Previous Close
14.9 6
Open
14.7 9
Low
14.7 9
High
14.7 9
Volume
25
Financials
Value 202020212022202320242025 Current
Key stats
Valuation ratios
Profitability ratios
Liquidity ratios
Solvency ratios
Per share metrics
News
Seanergy Maritime: Half The Year Is Already Sold - Maintaining Strong Buy (NASDAQ:SHIP)
Why the Market Dipped But Seanergy Maritime Holdings Corp (SHIP) Gained Today
Is It Worth Investing in Seanergy Maritime Holdings (SHIP) Based on Wall Street's Bullish Views?
Is Trending Stock Seanergy Maritime Holdings Corp (SHIP) a Buy Now?
Flash Memory Chipmaker Sandisk Hits Record High, Leads 18 Onto Best Growth Stock Lists
Here's Why Seanergy Maritime Holdings Corp (SHIP) Fell More Than Broader Market
Seanergy Maritime Holdings Corp (SHIP) Declines More Than Market: Some Information for Investors
AI Cool Play Vertiv Joins 2 Best Stock Lists, Leads Group Of 14 New To IBD 50, Big Cap 20, More
Aerospace Hotshot Woodward Leads 14 Newcomers Onto Best Stock Lists
Seanergy Maritime Holdings Corp (SHIP) Suffers a Larger Drop Than the General Market: Key Insights
Seanergy Maritime Holdings Corp (SHIP) is Attracting Investor Attention: Here is What You Should Know
Charts & Ideas
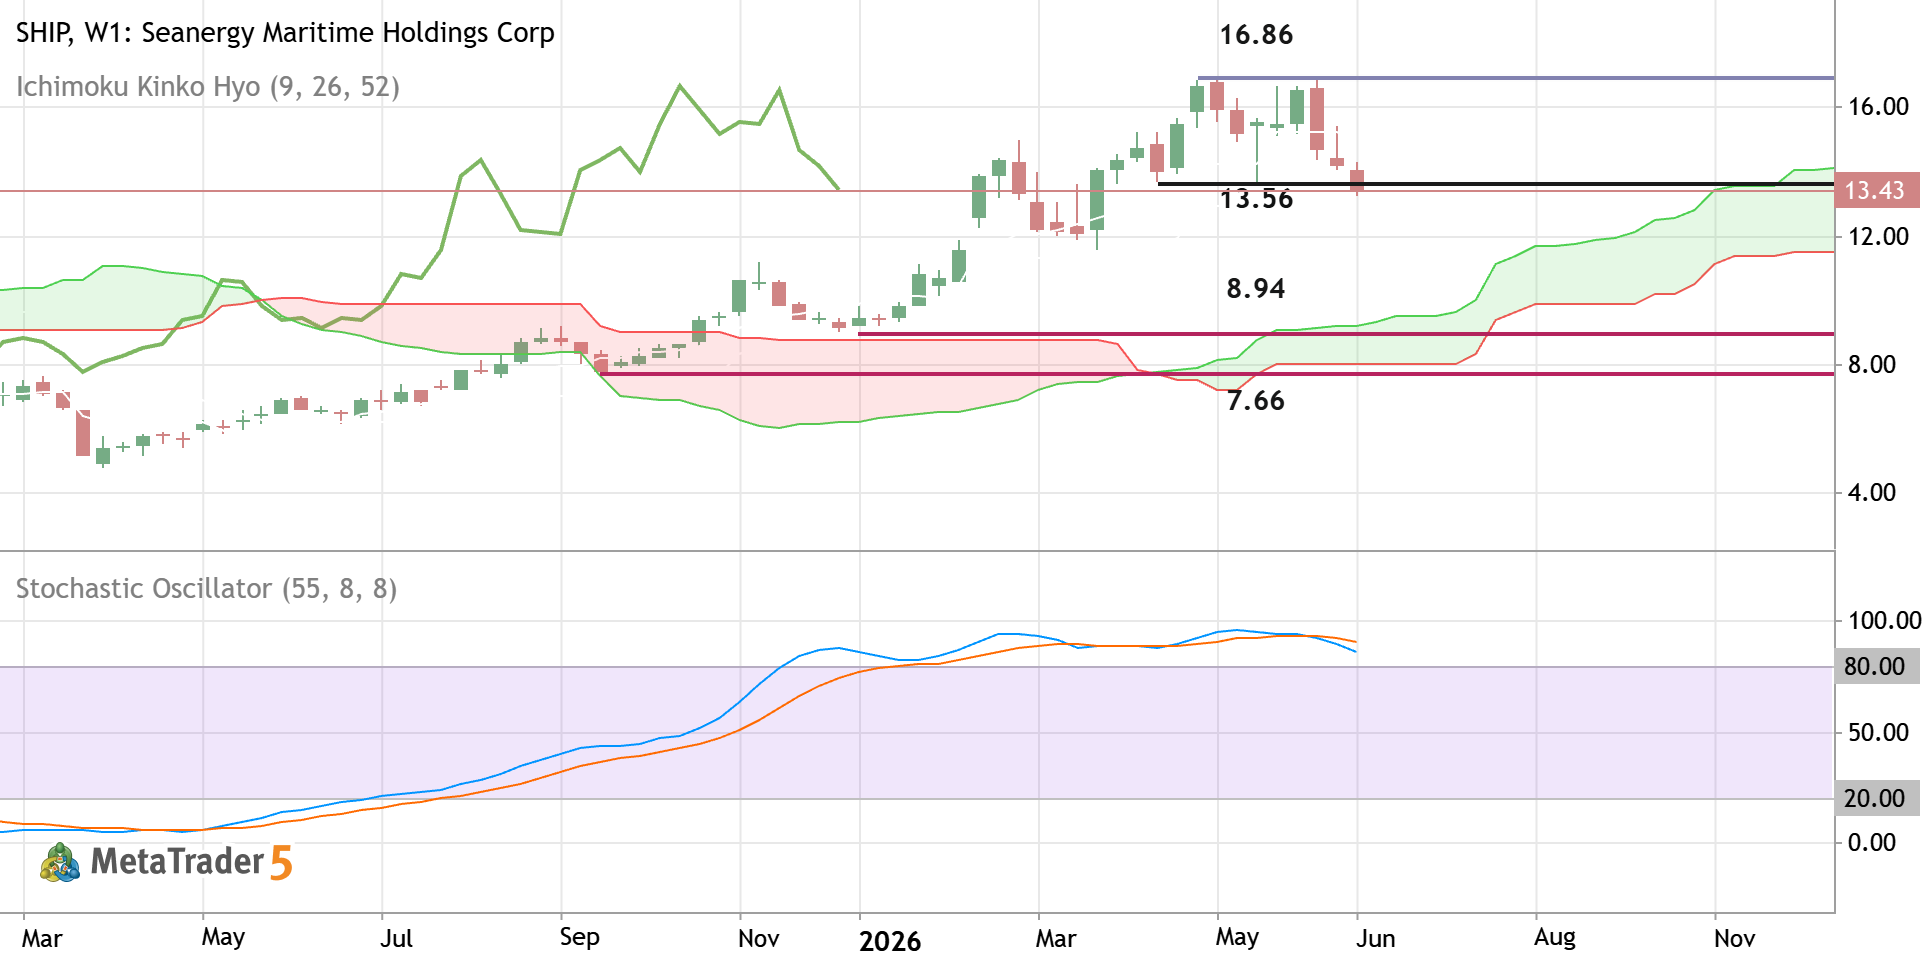
SHIP - Long-Term Technical Forecast
The weekly price is located above Ichimoku cloud in the bullish area of the chart. The price was bounced from support level at 16.86 to below for trying to break the next support level at 13.56 for the secondary correction to be started. If the price breaks the level at 13.56 to below on weekly close bar so we may see the secondary correction within the primary bullish market condition. If the price crosses 8.94 support to below together with the next support level at 7.66 so the primary bearish reversal will be started. Alternatively, the price will be on ranging to be near and above Ichimoku cloud waiting for the direction of the strong trend to be started. Trading Summary : ranging to the secondary correction
0 

The SHIP doesn’t have other trading ideas at this time
Browse ready-made trading ideas or select a symbol and create your own
Go to Charts and Trading Ideas