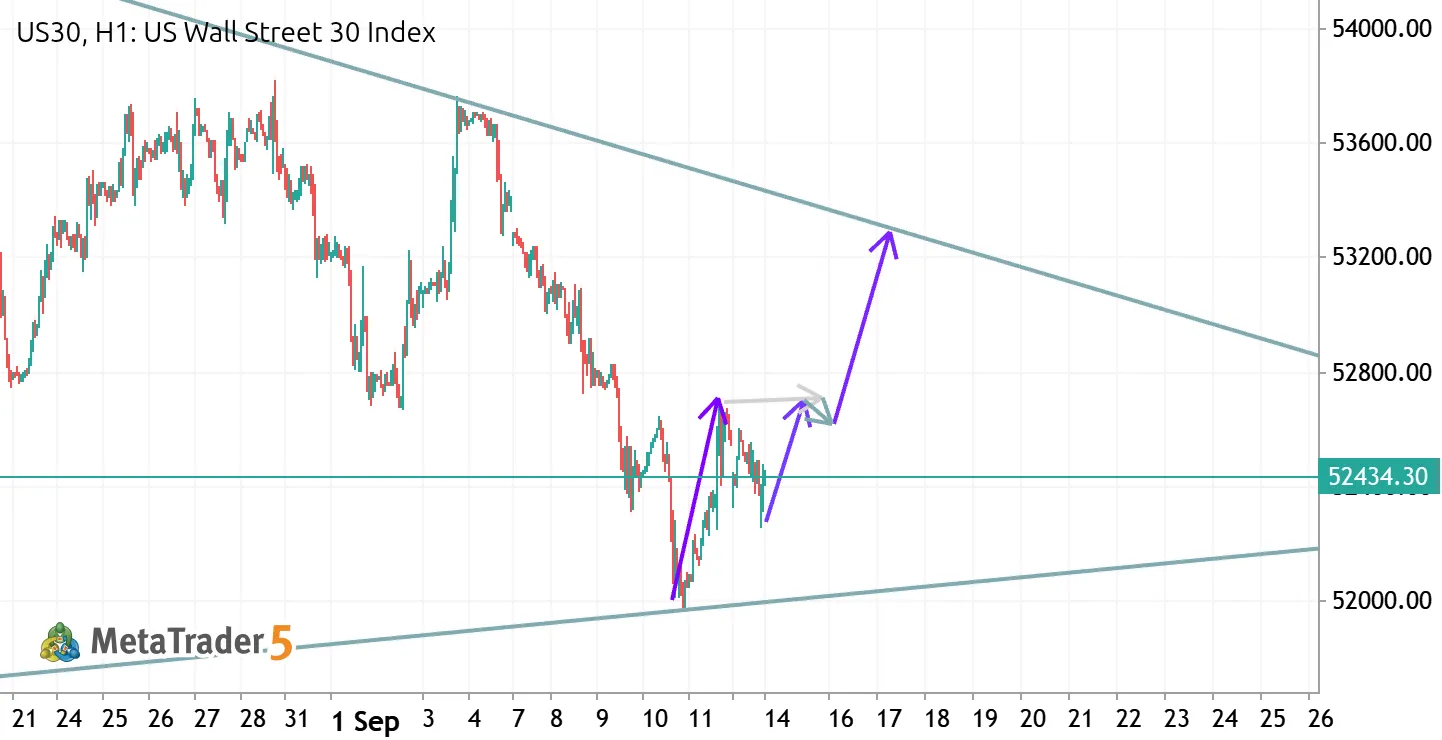
US30 Technical Analysis & Strategy Guide 30 US30 Long US Wall Street 30 Index
US30 Technical Analysis & Strategy Guide
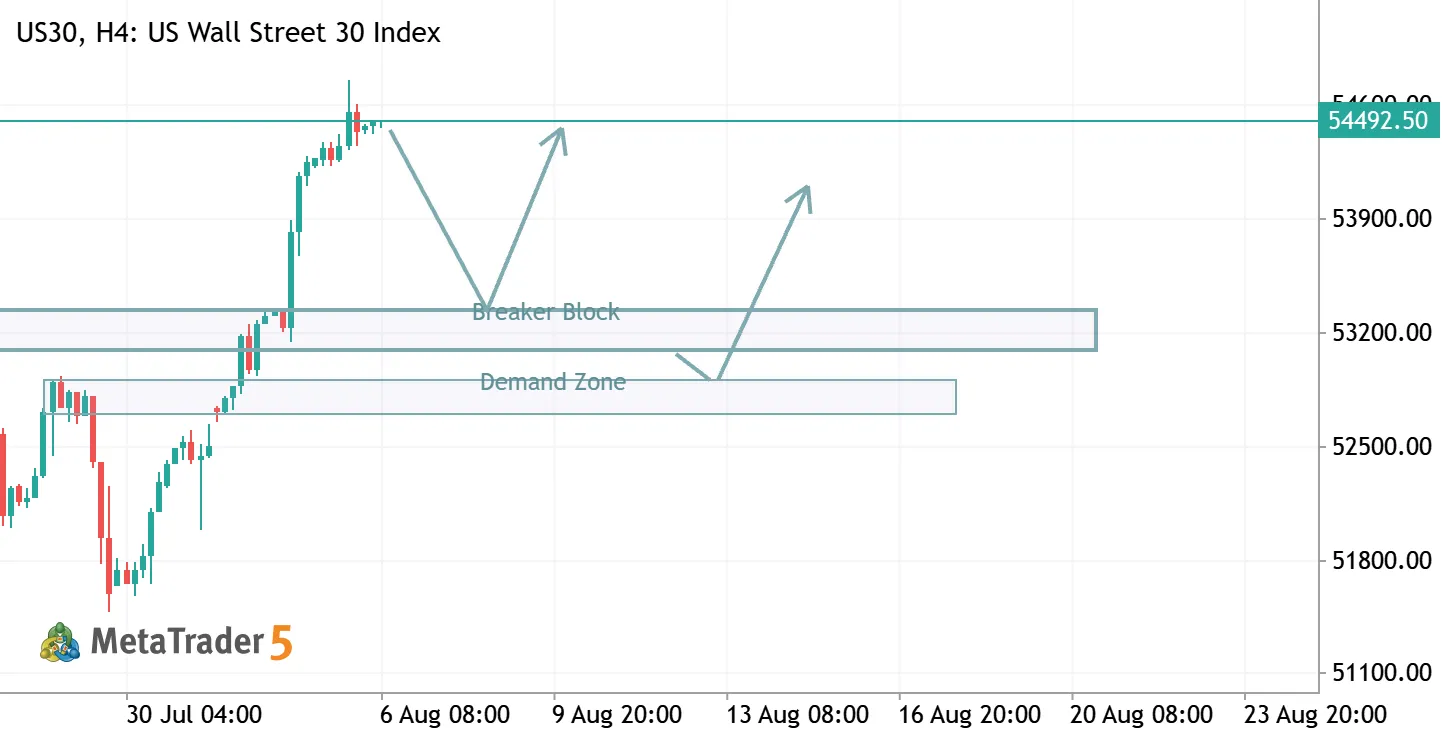
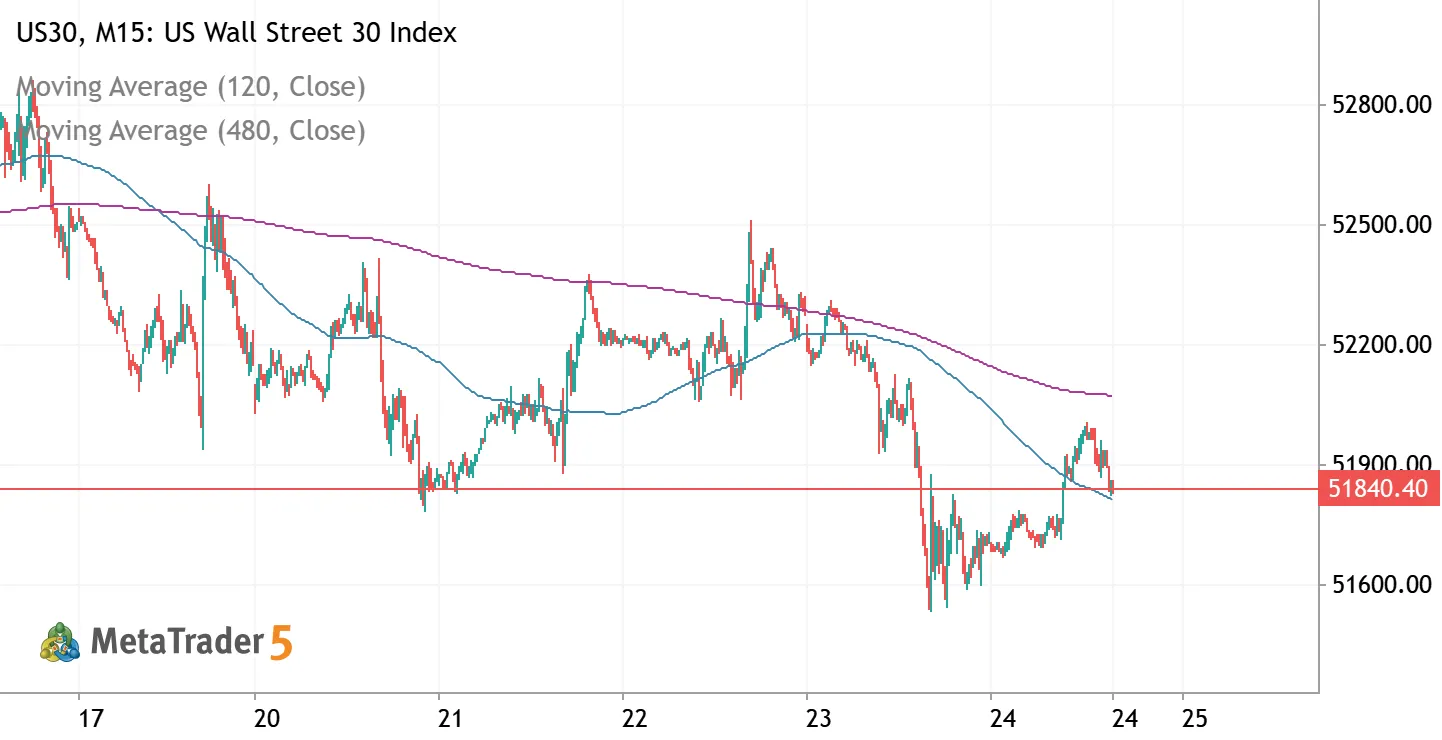
🚨 DISCLAIMER Not Financial Advice: This analysis is strictly for educational and informational purposes only. Forex, indices, and financial market trading carry a high level of risk. Always conduct your own research and apply strict risk management before opening any positions. 📊 Market Structure & Context Trading Pair / Instrument: US30 / Dow Jones Industrial Average (Wall Street 30 Index) Timeframe: H4 (4-Hour) Dominant Trend: Strong Bullish Expansion / Upward Momentum Current Key Resistance Level: ~54,493.00 The US30 chart demonstrates an aggressive, vertical bullish expansion. However, entering long positions at the absolute top (54,493) presents an unfavorable Risk-to-Reward ratio. Smart Money Concepts (SMC) favor waiting for liquidity retracements back into institutional
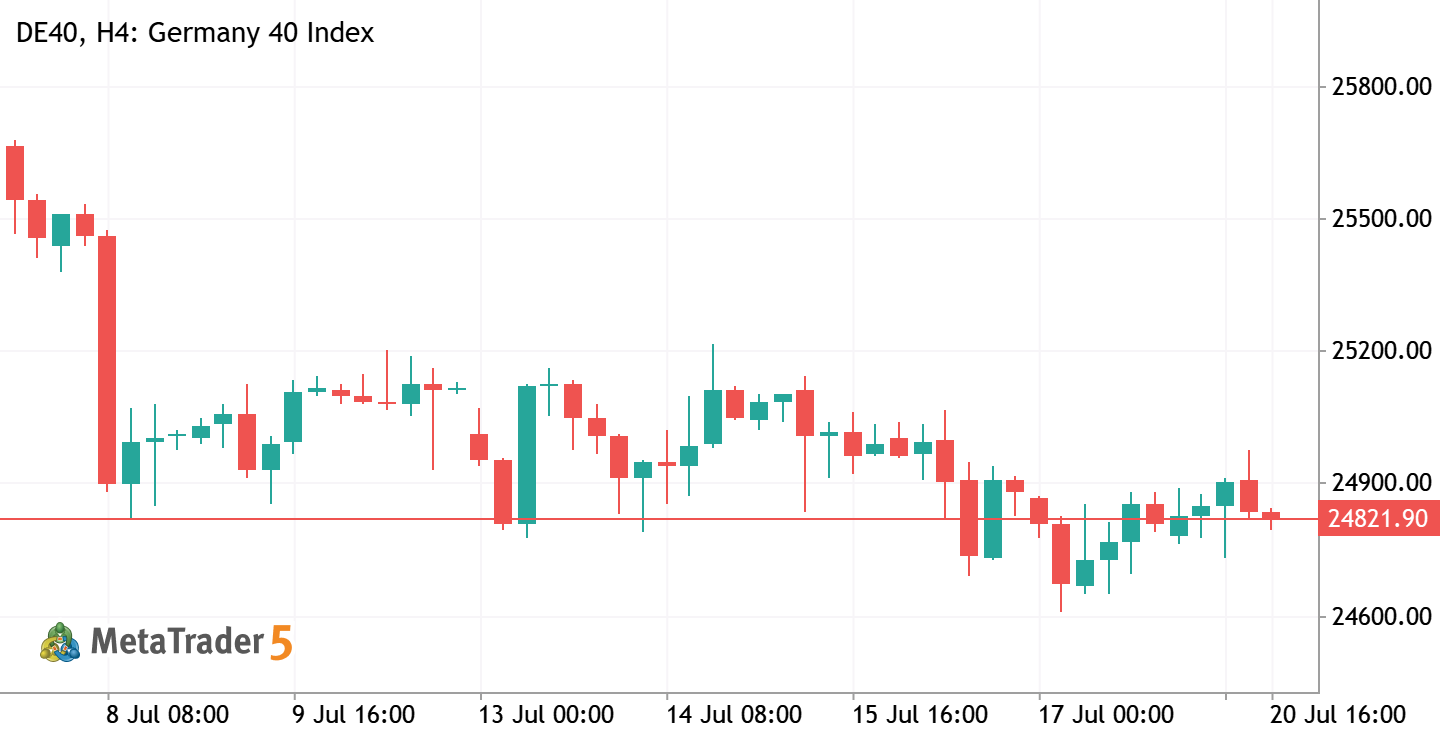
DAX — week of July 20 – 24, 2026; SHORT 40 DE40 Short Germany 40 Index
DAX — week of July 20 – 24, 2026; SHORT
DAX — week of July 20 – 24, 2026 SHORT Two weeks ago the 26,064 'breakout' was a trap I called; last week the tape fade-and-flushed to 24,715 , exactly where I mapped it. Now it's coiled on the one number that matters, and almost nobody prints it: the weekly EMA ( 24,996 ), the weekly pivot ( 24,997 ), the 4H EMA ( 24,999 ) and the week's VWAP ( 24,950 ) are stacked inside a fifty-point knot at 24,950–25,000 . Price is sitting one tick above the whole cluster, bouncing a limp +0.3% off Friday's 24,715 low. That knot is the hinge — not the obvious 26,000 top, not the round 25,000 the tourists circle. Above it sits a tight ceiling: R1 at 25,279 tucked under last week's 25,343 high, a 64-point band where every bull trapped at 26,000 waits to average down. I'm a seller into 25,279–25,343 for
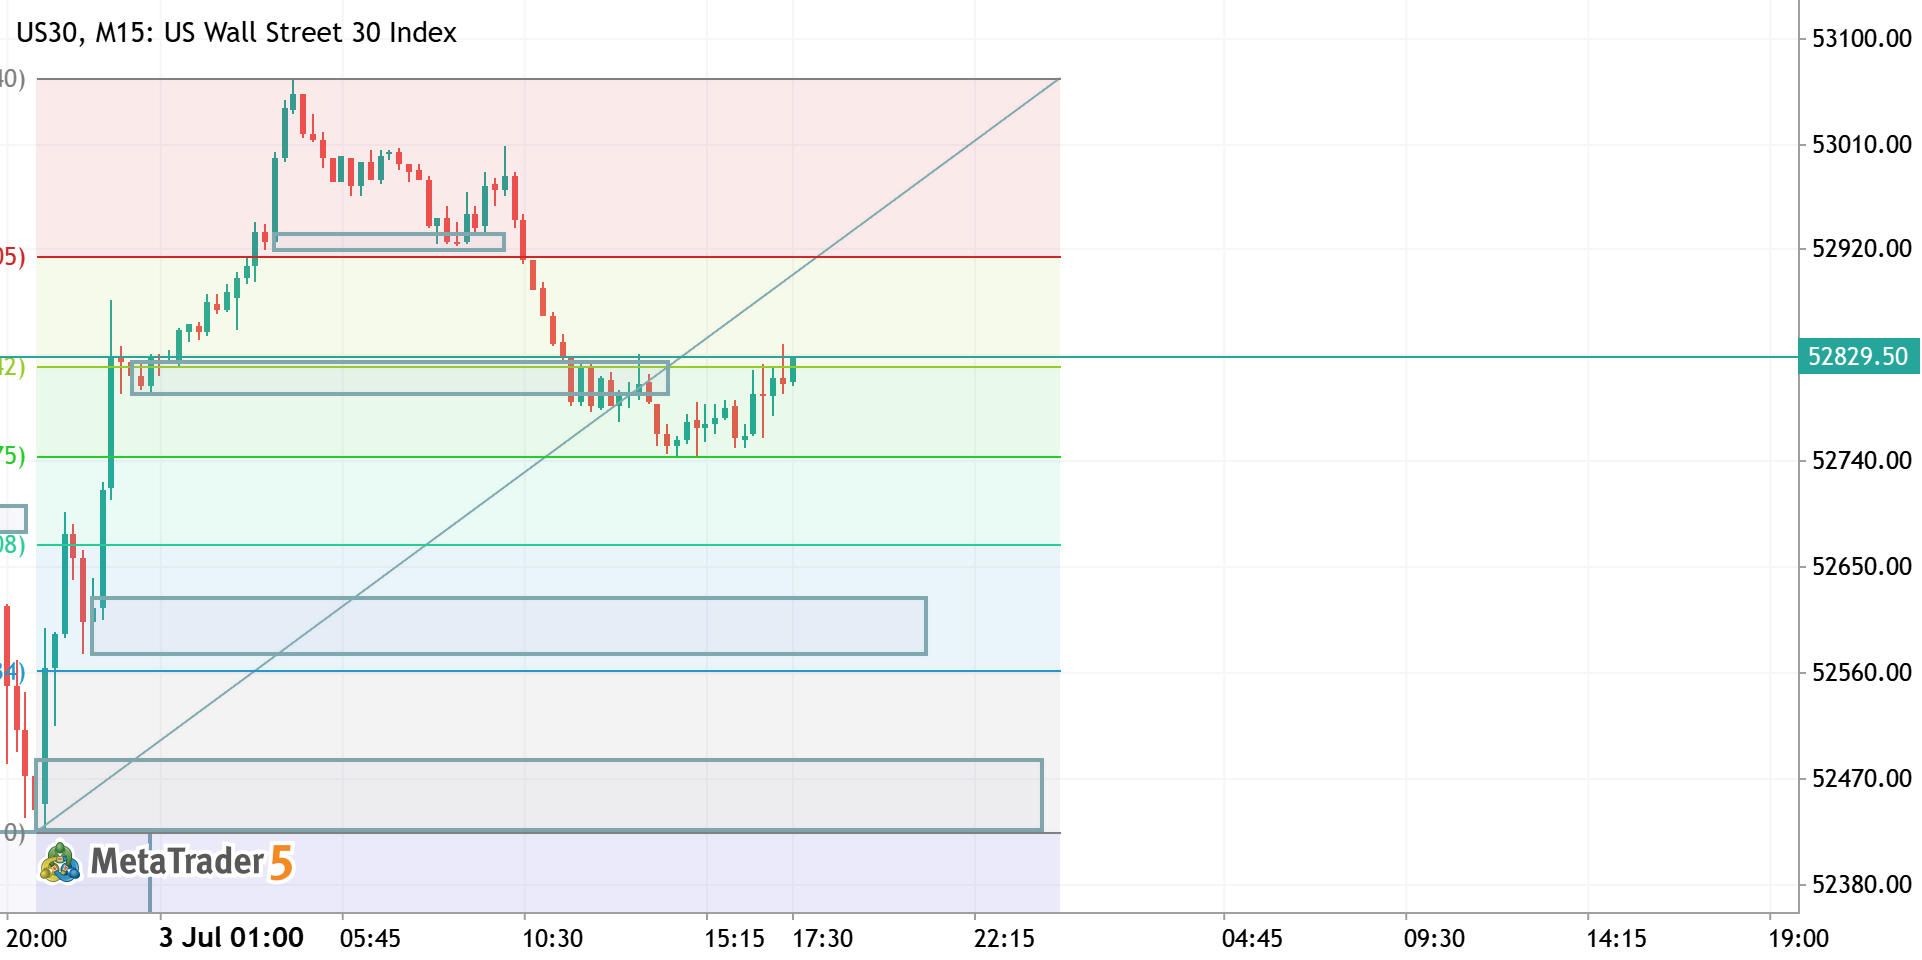
US100 – Potential Buy Opportunity After Liquidity Expansion TEC USTEC Long US Tech 100 Index
US100 – Potential Buy Opportunity After Liquidity Expansion
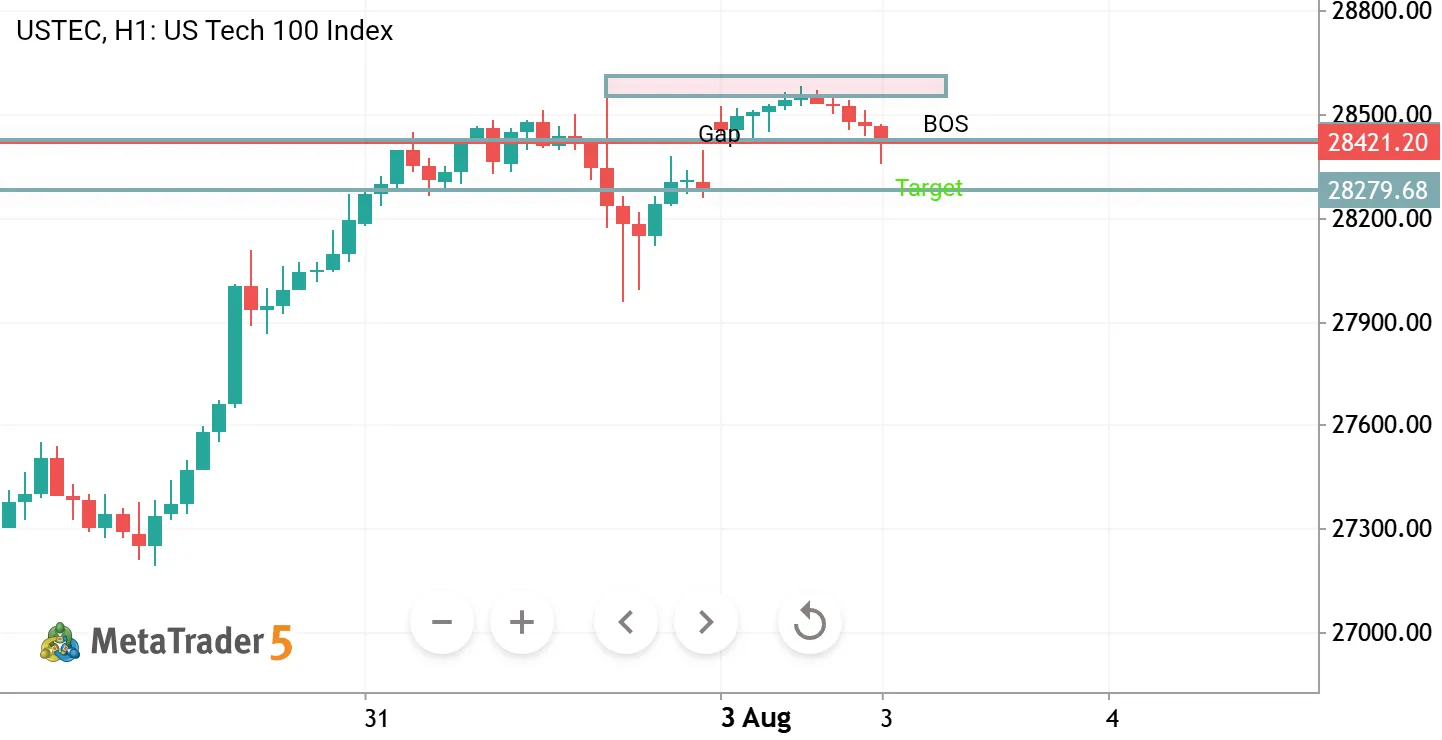
Market Context: The price action on US100 shows a strong bullish expansion followed by a corrective move into a key consolidation and high-volume area. After sweeping liquidity below the previous structure and reclaiming the range, price is now approaching a critical support zone aligned with volume accumulation. Key Observation: Liquidity sweep below previous lows Strong bullish impulse move upwards Pullback into high-volume consolidation area (value zone) Reaction expected around institutional buying interest level Trade Idea: I am expecting a potential continuation to the upside after a retracement into the highlighted buy zone. This area aligns with previous volume consolidation, making it a high-probability reaction zone. Scenario: Price may first retest the upper resistance area