XBRUSD - Daily Trading Forecast
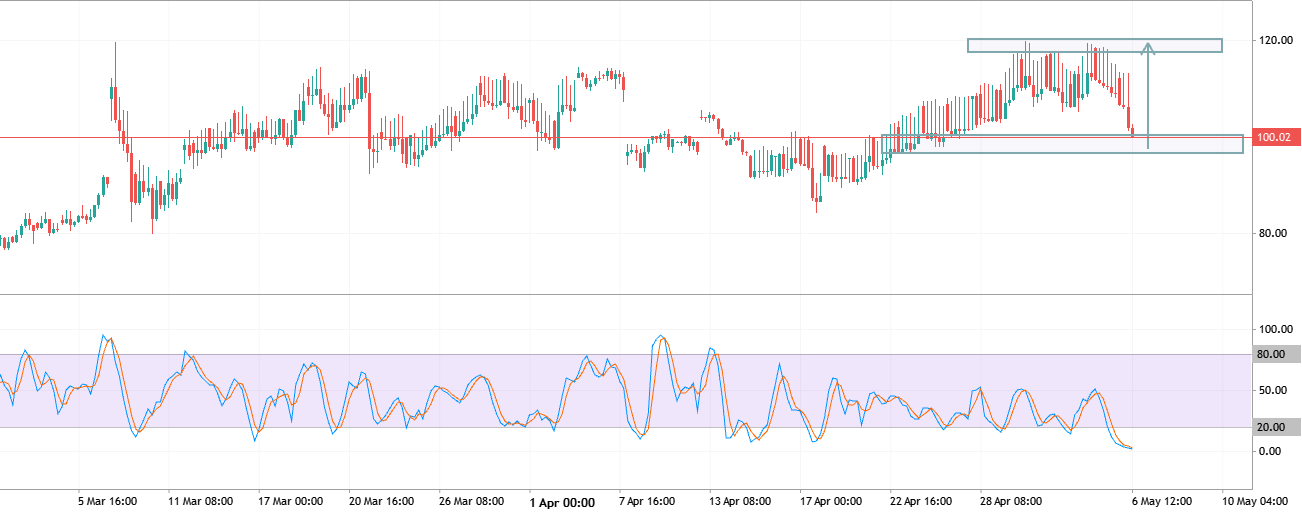
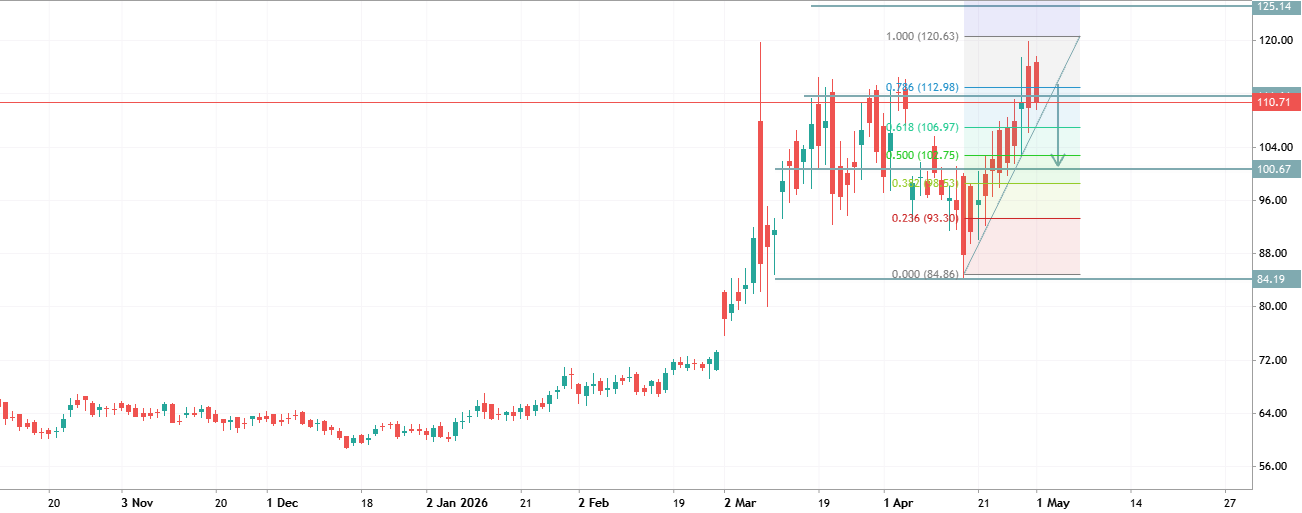
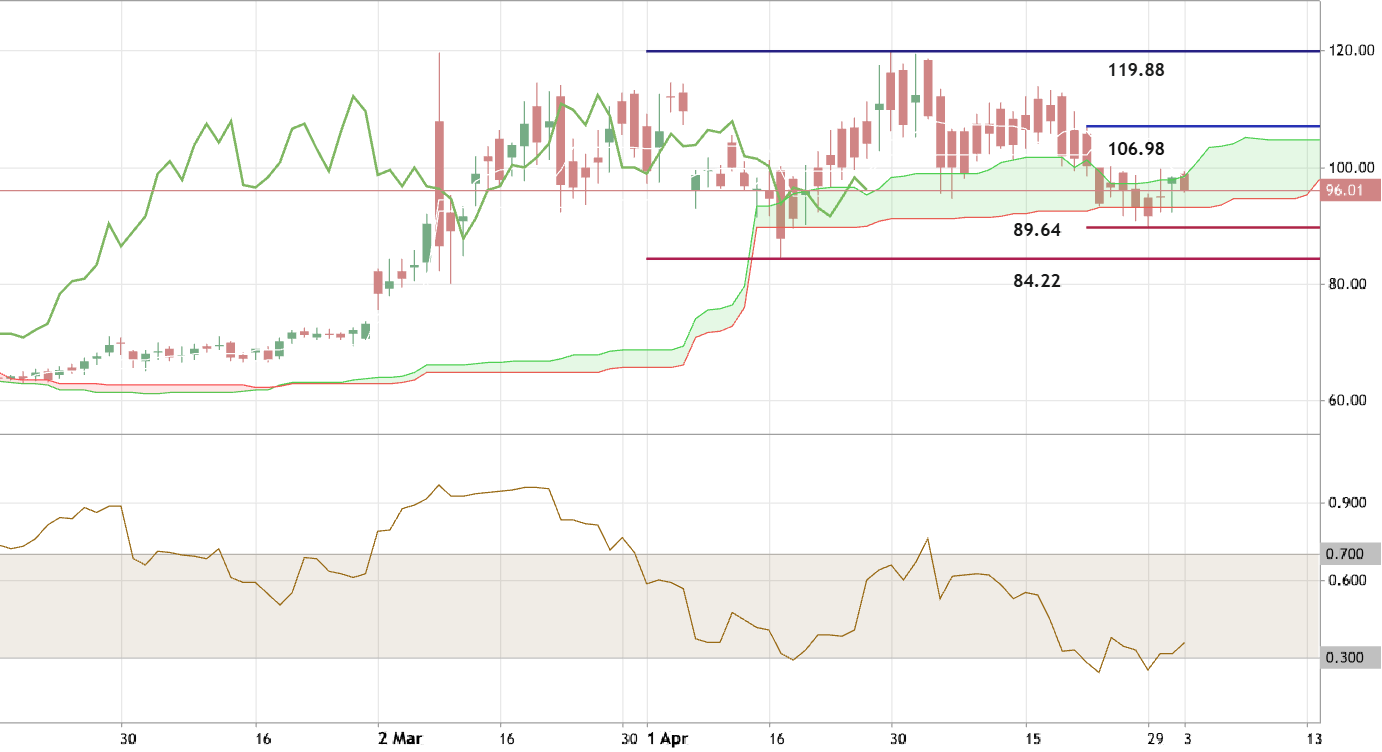
Daily price is on ranging to be inside Ichimoku cloud and in the s/r channel for direction: if the price breaks resistance level at 106.98 to above so the primary bullish trend will be resumed with 119.88 level as a possible target; if the price crosses support level at 89.64 to below so the primary bearish reversal will be started with 84.22 level to re-enter; alternatively, the price will be on secondary ranging waiting for direction. Trading Summary : ranging for direction
4