Nasdaq 100 Linear Regression Channel Analysis
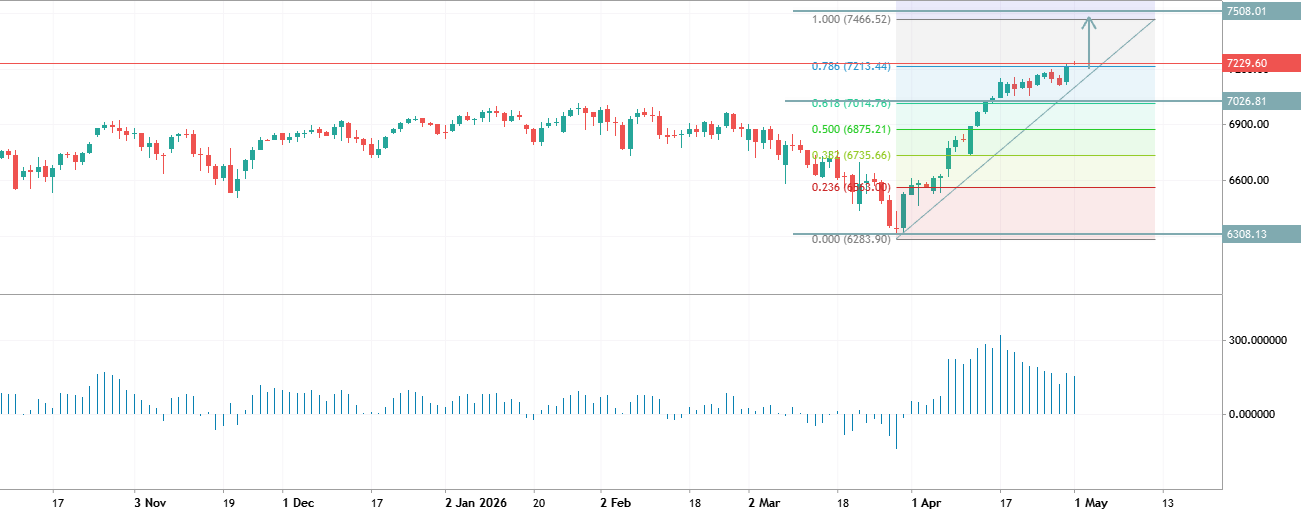
**[Nasdaq 100 Linear Regression Channel Analysis Summary]** --- ### 1. Review of the Late March Buy Signal * **Event:** Price broke below the lower channel boundary (-2SD) and then re-entered ➔ **BUY Signal Confirmed**. * **Result:** Mean reversion triggered at the statistical bottom, fueling a powerful 2-month uptrend. ### 2. Current Upper Breakout & Why No Signal Has Appeared * **Event:** Price is surging past the upper channel line (+2SD), yet no sell arrow has printed. * **Reason:** The system triggers a sell signal only when the price **breaks back down inside** the upper boundary, not simply when it touches or exceeds it. * **Interpretation:** The absence of a signal means the market is in a state of **extreme bullish momentum (trend extension)**, rising faster than the channel's
0