XTIUSD - Daily Trading Forecast XTIUSD Long Crude Oil vs US Dollar
XTIUSD - Daily Trading Forecast
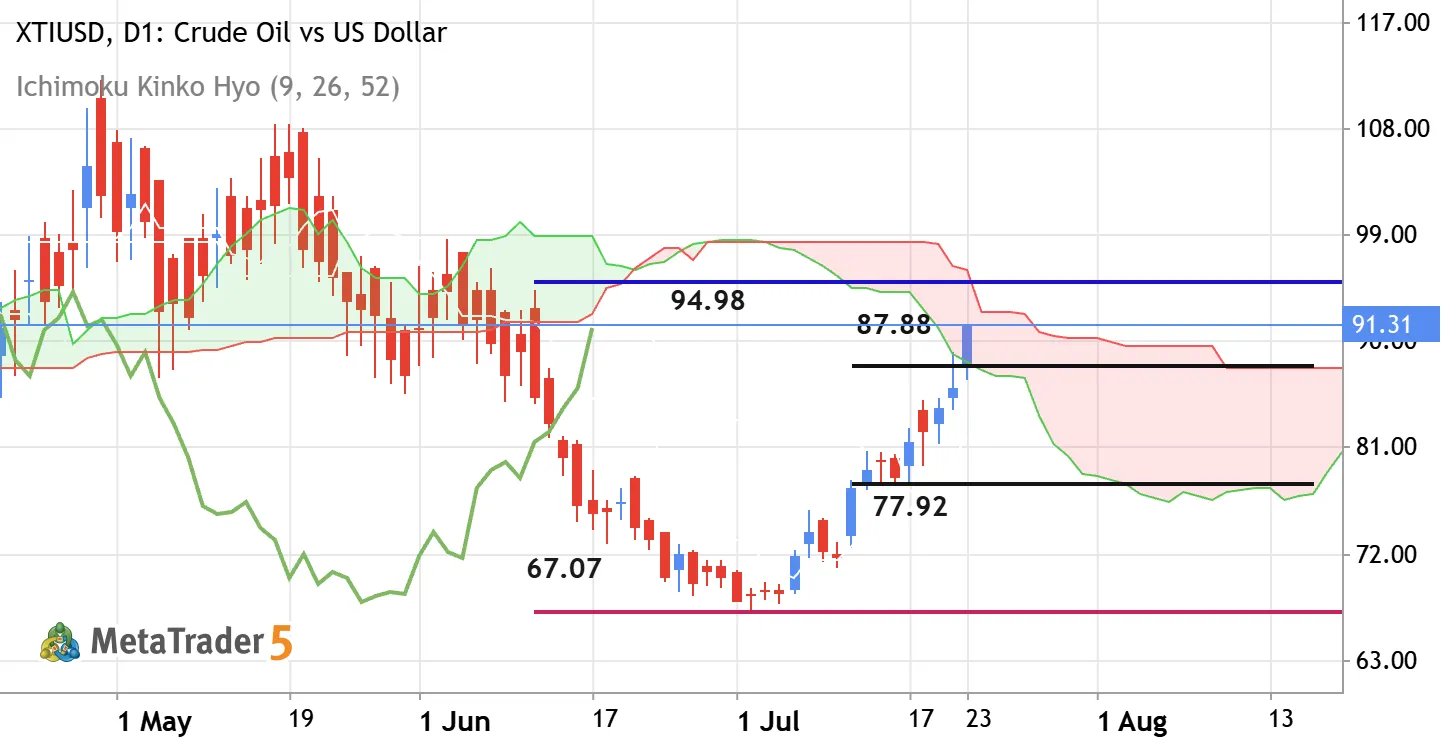
Daily price is breaking Ichimoku cloud together with the level at 87.88 to above for the primary bullish reversal. Stochastic oscillator is showing the uptrend in the near future, and Chinkou Span indicator broke the historical price for the good breakout to started. If the price breaks the level at 87.88 to above so the daily bullish reversal will be started with 94.98 level to re-enter. If the price crosses support level at 77.92 to below so the daily bearish trend will be resumed with 67.07 possible target for example. Alternatively, the price will be ranging near within s/r channel waiting for the direction of the strong trend to be started. Trading Summary : daily breakout with the possible daily bullish reversal

XBRUSD - Daily Trading Forecast XBRUSD Brent Oil vs US Dollar
XBRUSD - Daily Trading Forecast
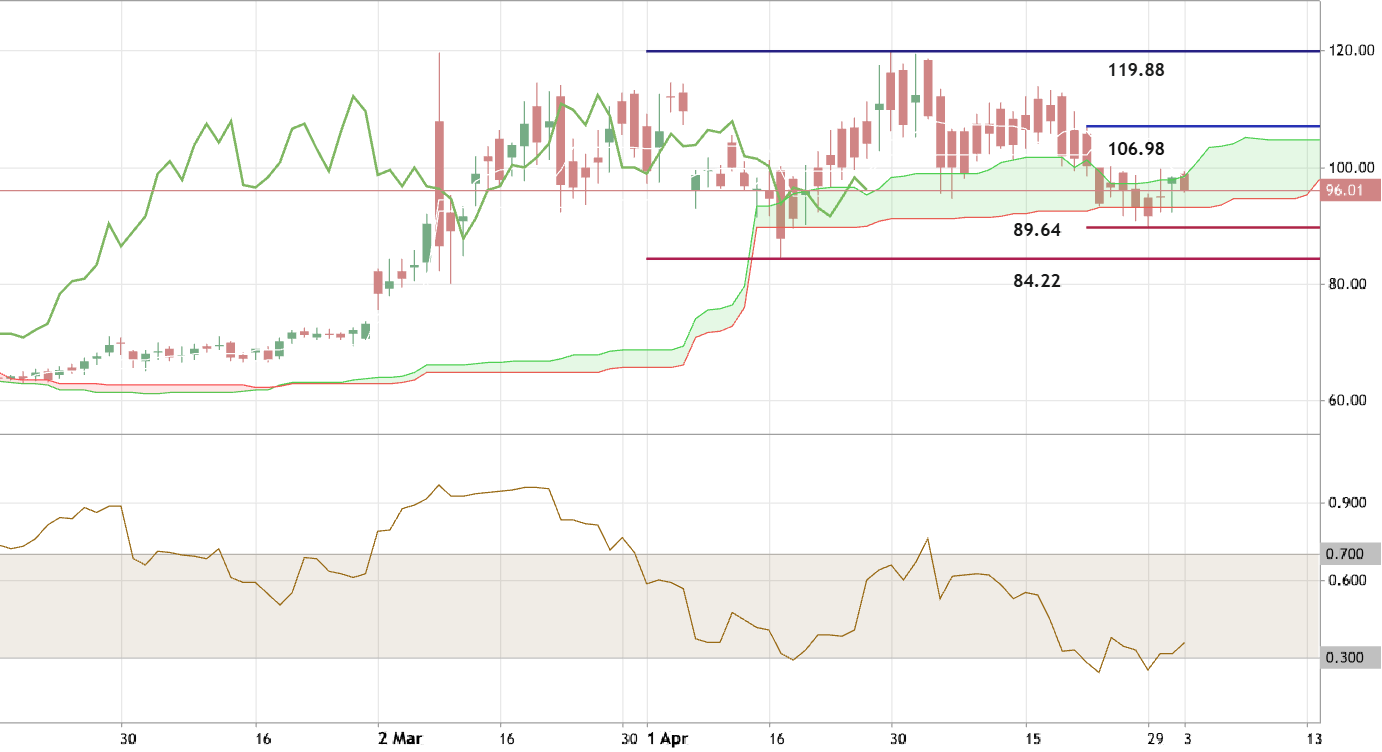
Daily price is on ranging to be inside Ichimoku cloud and in the s/r channel for direction: if the price breaks resistance level at 106.98 to above so the primary bullish trend will be resumed with 119.88 level as a possible target; if the price crosses support level at 89.64 to below so the primary bearish reversal will be started with 84.22 level to re-enter; alternatively, the price will be on secondary ranging waiting for direction. Trading Summary : ranging for direction
USOIL ALERT! XBRUSD Long Brent Oil vs US Dollar
USOIL ALERT!
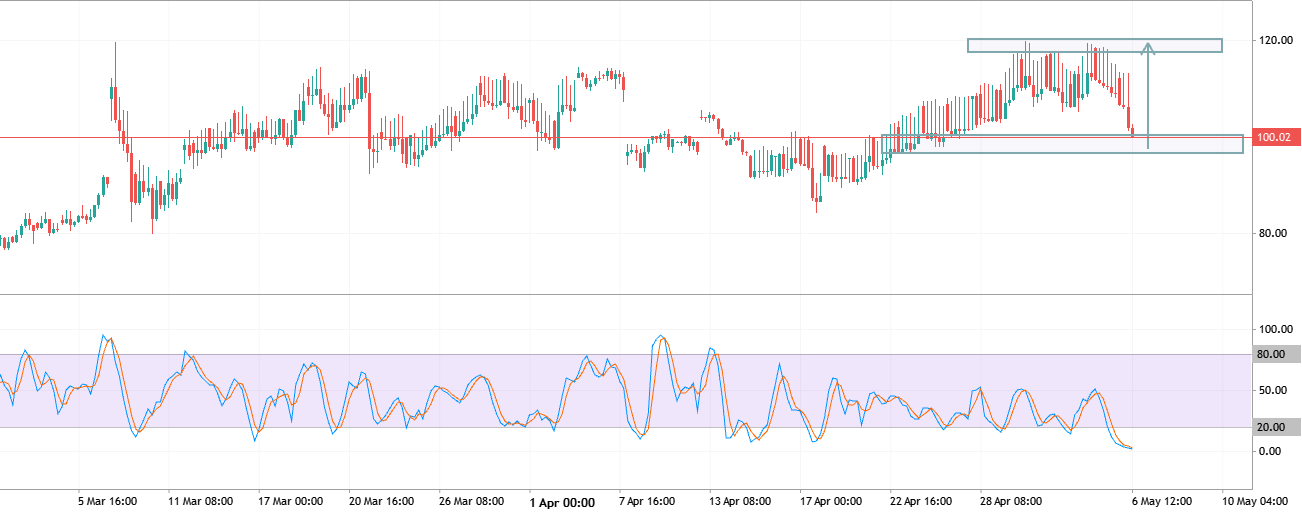
USOIL ALERT! 🛢️ Oil is currently reacting from a strong support zone near 96–100 after a sharp liquidity sweep from the highs. 📈 Price is still holding the bullish structure, and this pullback could become a buying opportunity if buyers defend the support area. ⚡️ We are considering buying USOIL ONLY if price holds above 100; 🎯 Target 1: 108; 🎯 Target 2: 118. ❌ Invalidation: Break below 96 support. Click ❤️ if you are bullish 🔥
Brent (XBRUSD) Analysis XBRUSD Short Brent Oil vs US Dollar
Brent (XBRUSD) Analysis
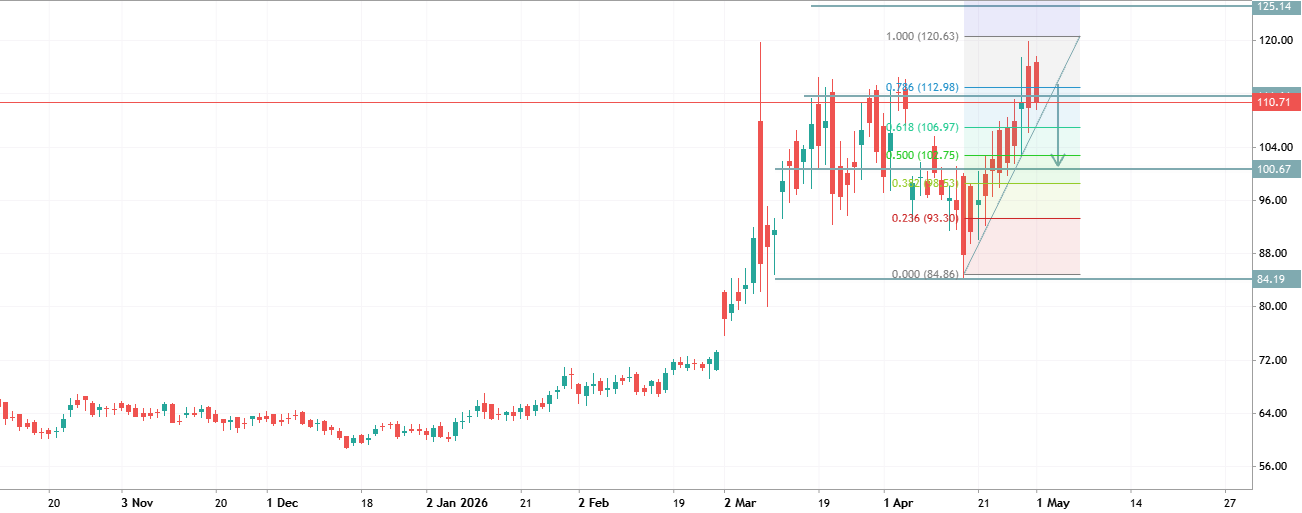
Brent is trading in a strong uptrend, with price approaching the 1.000 Fibonacci resistance (~120.60) after a sustained bullish move. The market is currently overextended to the upside, testing key resistance levels, suggesting a possible breakout or pullback scenario. A break above 120.60 will open the way toward 132.00 (next Fibonacci expansion level); A rejection from current resistance may trigger a pullback toward 106.00 – 100.00 support zone
XNGUSD - Long-Term Technical Forecast XNGUSD Natural Gas vs US Dollar
XNGUSD - Long-Term Technical Forecast
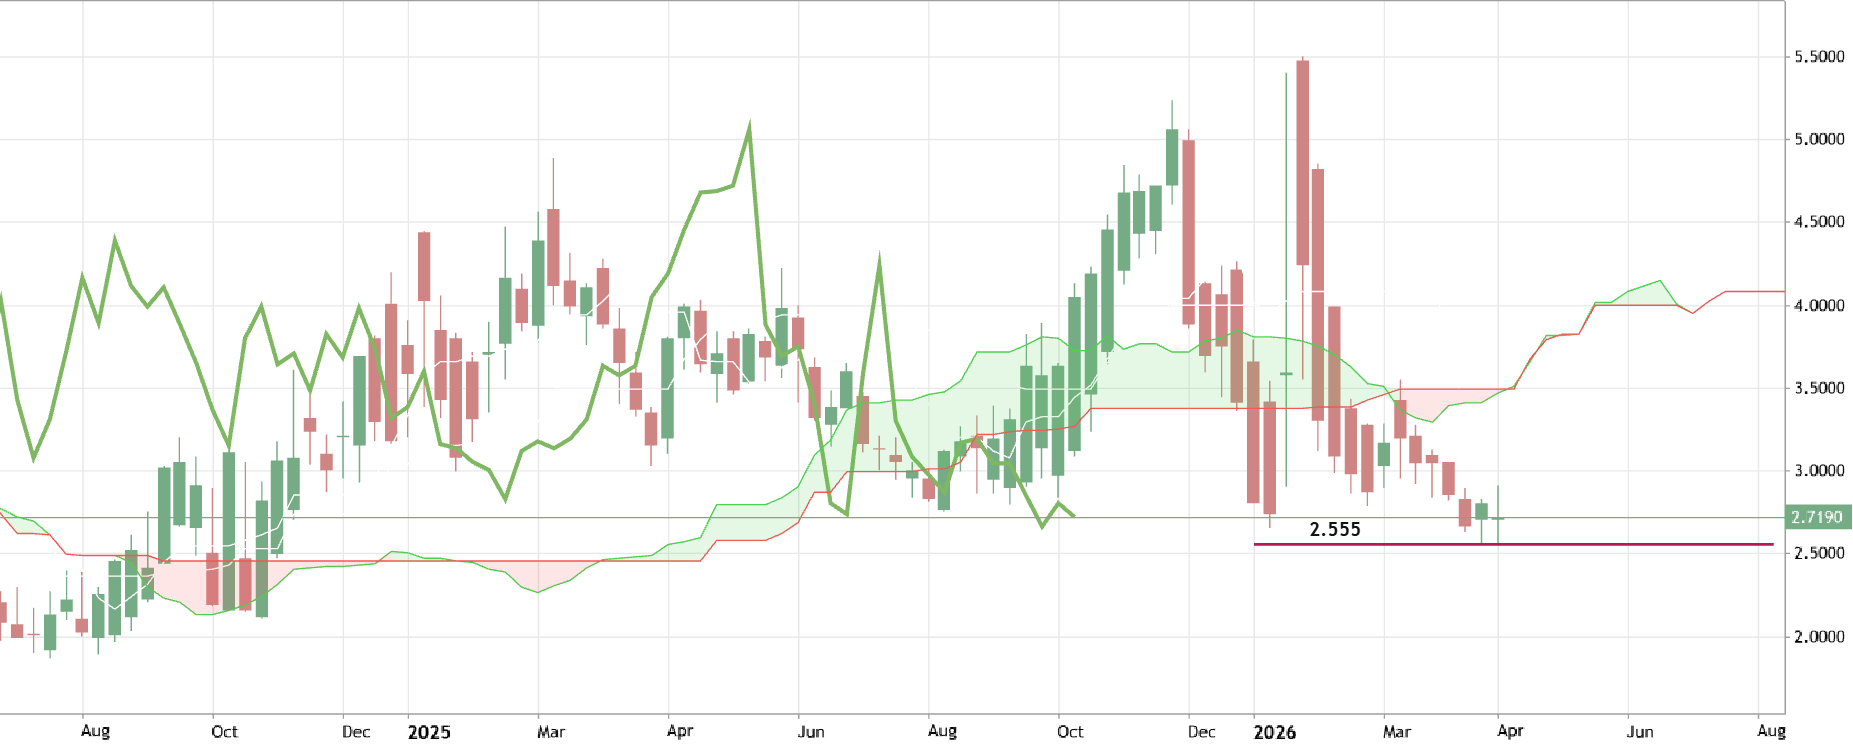
The weekly price is located below Ichimoku loud in the bearish area of the chart. The price is on ranging to be near and below Ichimoku cloud for trying to break the support level at 2.555 to below for the bearish ranging trend to be continuing. Alternatively (and based on fundamental factors) the price will be bounced from the support level to above for the primary bullish reversal to be started. Most likely scenario : ranging
Trading Ideas for 2026: XBRUSD - Technical Forecast and Levels XBRUSD Brent Oil vs US Dollar
Trading Ideas for 2026: XBRUSD - Technical Forecast and Levels
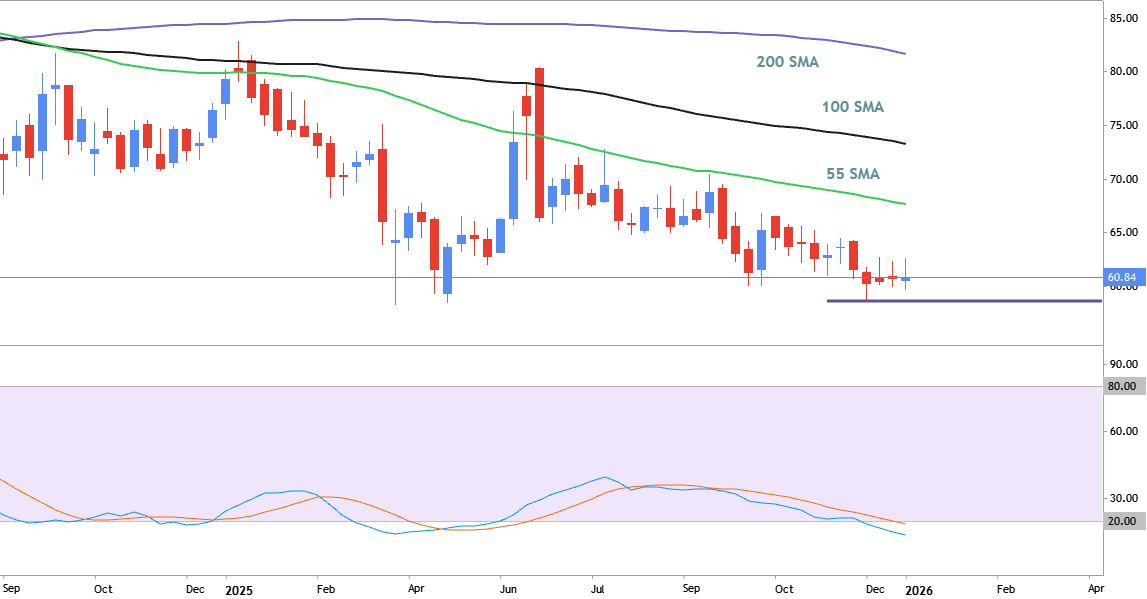
XBRUSD weekly price is below 200 SMA in the bearish area of the chart. The descending triangle pattern was formed to the price for the bearish trend to be continuing. But Stochastics is indicating the oversold market condition so the bearish continuation is possible in case of some fundamental factors for WTI for example. If the price breaks support level at 58.55 to below so the bearish trend will be continuing. Alernatively, we will see the ranging up to the bear market rally (which also depends on the strong fundamental news events for example).