Nasdaq 100 Linear Regression Channel Analysis
TEC
USTEC US Tech 100 Index
Nasdaq 100 Linear Regression Channel Analysis
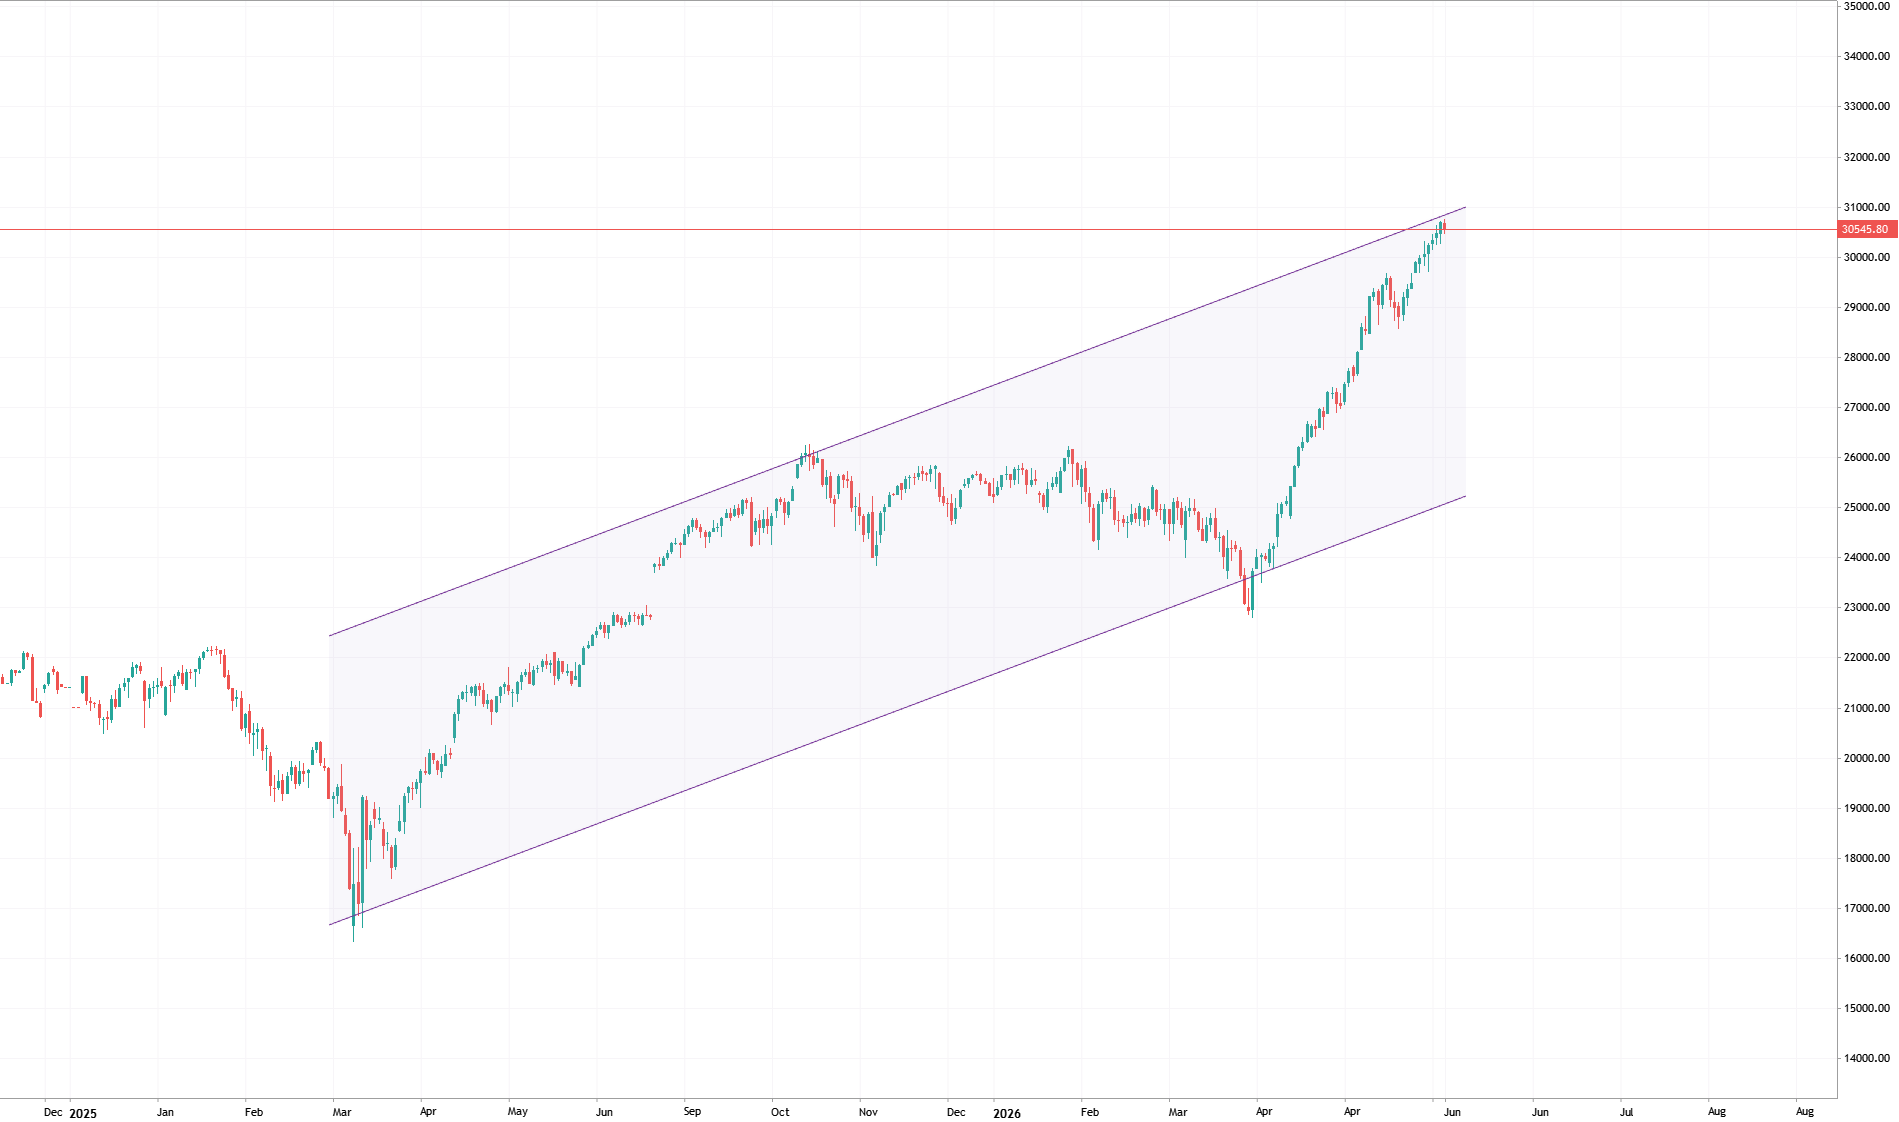
**[Nasdaq 100 Linear Regression Channel Analysis Summary]** --- ### 1. Review of the Late March Buy Signal * **Event:** Price broke below the lower channel boundary (-2SD) and then re-entered ➔ **BUY Signal Confirmed**. * **Result:** Mean reversion triggered at the statistical bottom, fueling a powerful 2-month uptrend. ### 2. Current Upper Breakout & Why No Signal Has Appeared * **Event:** Price is surging past the upper channel line (+2SD), yet no sell arrow has printed. * **Reason:** The system triggers a sell signal only when the price **breaks back down inside** the upper boundary, not simply when it touches or exceeds it. * **Interpretation:** The absence of a signal means the market is in a state of **extreme bullish momentum (trend extension)**, rising faster than the channel's
0
EricYosi Koo Hotbeom 2026.06.03 17:39
Trading Ideas for 2026: USTECH100mini - Technical Forecast and Levels
100
USTECH100M USTECH100mini
Trading Ideas for 2026: USTECH100mini - Technical Forecast and Levels
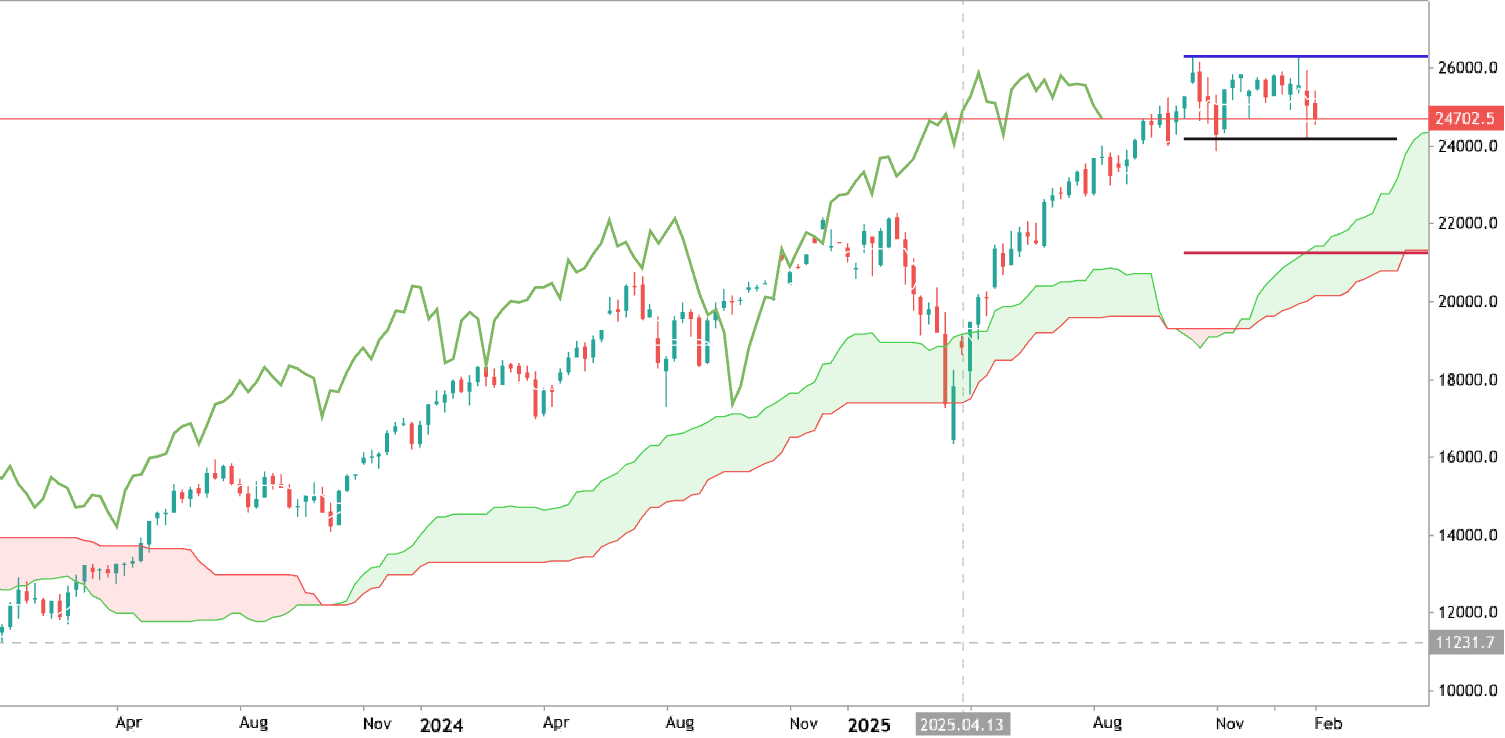
The weekly price is located above Ichimoku cloud in the bullish area of the chart. The price is on ranging within 24161/26288 support/resistance channel. If the price breaks 26288 resistance to above so the primary bullish trend will be continuing. If the price crosses 24161 support to below so the secondary correction will be started with 21250 support as good target to re-enter for the possible bearish reversal for example. Recommendation: watch Chikou Span like for possible bearish breakdown; otherwise - ranging
2
newdigital Sergey Golubev 2026.02.14 08:03
NIKKEI 225 Index: ranging to correction or bullish to be continuing?
225
JPN225 Nikkei 225
NIKKEI 225 Index: ranging to correction or bullish to be continuing?
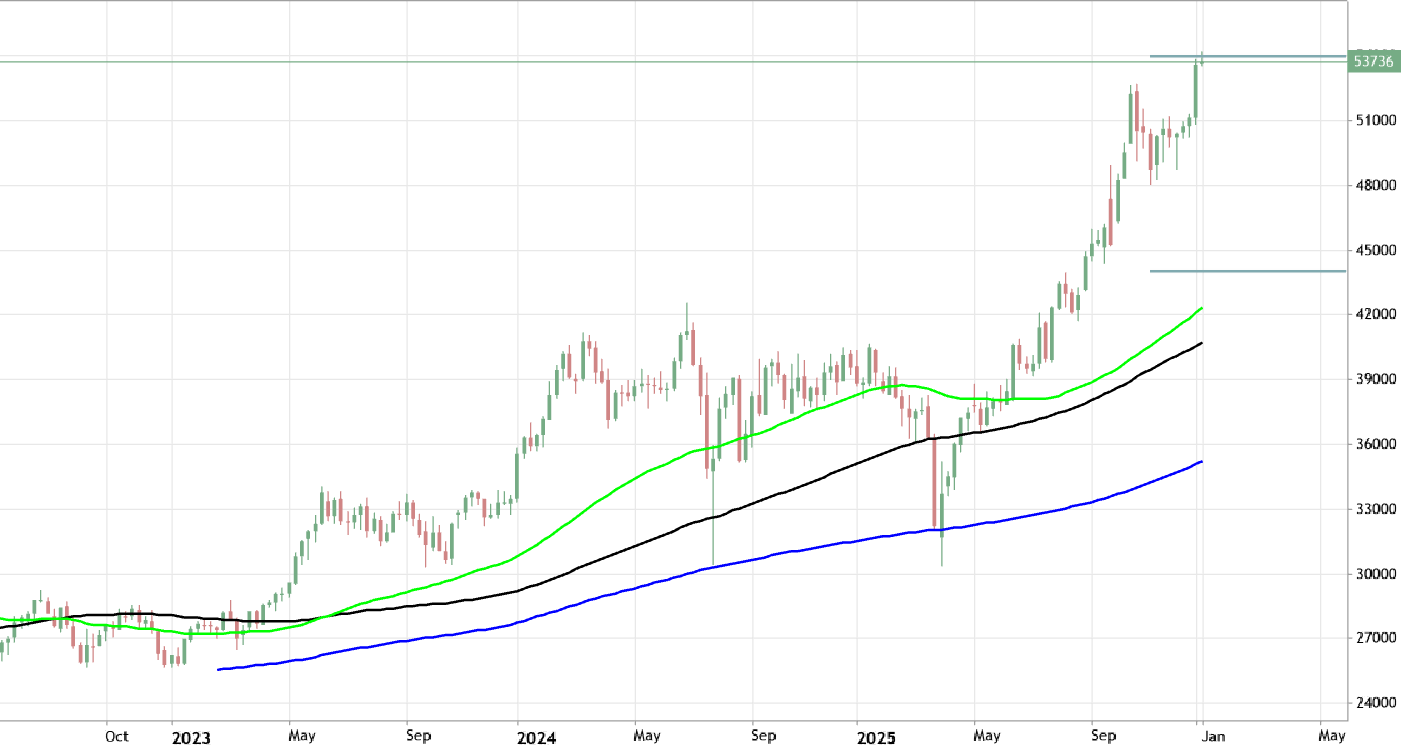
NIKKEI 225 Index weekly price is located far above 200 SMA, 100 SMA and 55 SMA as well in the bullish area of the chart. The price is trying to break the ascending triangle pattern with resistance level at 53937 to above for the bullish trend to be continuing. Alternatively, the price will be on ranging condition within s/r levels at 44010/53937 waiting for direction of the strong bullish trend to be continuing or the secondary correction to be started.
2
newdigital Sergey Golubev 2026.01.13 07:21