
Ethereum has held above $2,250 as the market builds toward what feels like a decisive move in either direction. The recovery from the February lows has been real and sustained — but according to top analyst Darkfost, the participants who should be most convinced by it are doing the opposite of what conviction looks like.
The context behind that observation starts with how severe the preceding correction was. ETH fell approximately 65% from its last peak — a decline that placed it among the hardest-hit assets in a downturn that damaged the entire altcoin market. TOTAL2, which measures the combined market cap of altcoins excluding Bitcoin and stablecoins, shed more than 51% of its value over the same period. The selling was broad, deep, and extended enough to leave lasting marks on participant psychology.
The recovery since then has been meaningful. Ethereum is now trading more than 30% above the low it recorded on February 6 — a recovery that, in any normal market environment , would be drawing fresh buyers and building bullish consensus.
That consensus has not formed. Darkfost’s data shows that despite the 30% recovery, most investors remain unconvinced. They are not sitting on the sidelines waiting for confirmation. They are actively taking aggressive short positions against a market that has already moved significantly higher — a posture that sets up a specific dynamic the data is now making visible.
The Last Time Funding Looked Like This, the Bear Market Was Ending
Darkfost’s funding rate data is where the setup becomes historically significant. Throughout Ethereum’s 30% recovery from the February lows, funding rates on Binance have remained persistently negative — not briefly, not as a daily fluctuation, but as a sustained, month-long condition that reflects the collective positioning of participants who refuse to believe the rebound is real.
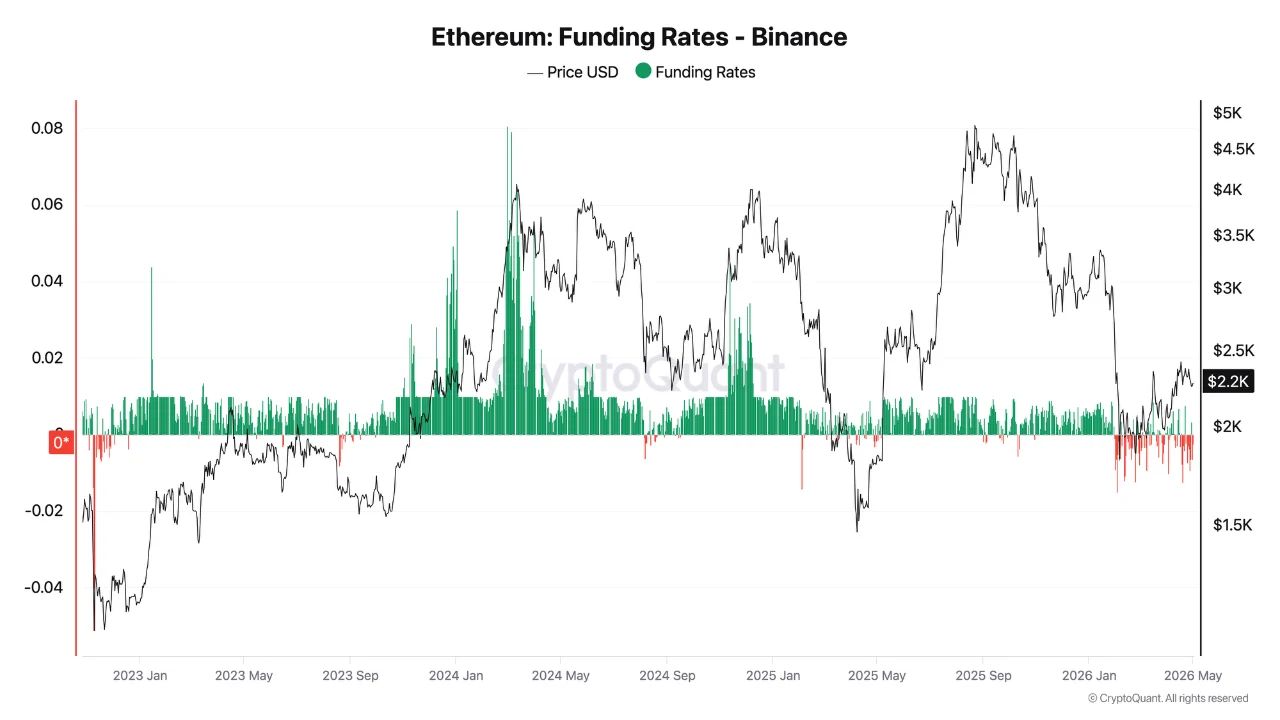
The monthly average funding rate currently sits at -0.0018. The last time funding remained this negative for this long was November 2022 — during the FTX collapse, at the end of the previous bear market. Darkfost is careful to note that today’s environment is not comparable to that moment in any fundamental sense. What is comparable is the behavioral fingerprint: a market recovering while the majority of derivatives participants position aggressively against it, paying persistently to maintain short exposure even as the price moves higher.
That bet is already extracting a cost. Short liquidation volumes have been rising as Ethereum’s upward momentum forces overleveraged positions out of the market. Each forced liquidation removes a short and adds buying pressure, which creates the potential for the recovery to feed on itself as more shorts are caught and closed.
Markets rarely reward the kind of consensus that currently surrounds Ethereum’s short side. The FTX-era parallel is not a prediction. It is a reminder that the strongest moves tend to start precisely when the most people are positioned against them.
Ethereum Tests Structure As Momentum Stalls Below Resistance
Ethereum is trading around $2,280 after a steady recovery from its February capitulation low near $1,800, but the chart shows a market losing momentum as it approaches a key resistance cluster. Price is now compressing between the rising short-term trend (around the 50-day moving average) and the descending 100-day and 200-day moving averages, which continue to slope downward and cap upside attempts.
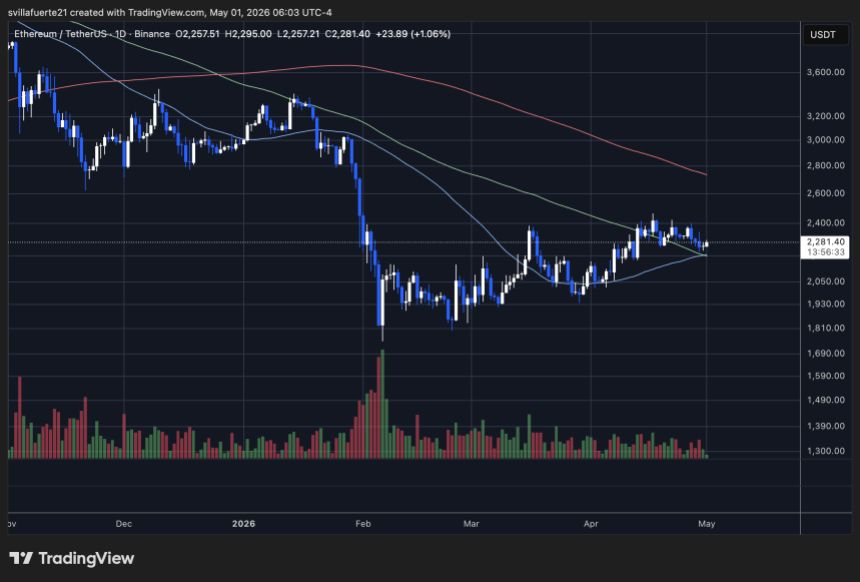
The recent structure is constructive but not yet bullish. Higher lows since mid-March indicate accumulation, yet each push toward the $2,350–$2,450 region has been rejected, forming a clear supply zone. This repeated failure suggests sellers remain active at higher levels, likely using rallies to distribute.
Volume reinforces the hesitation. The recovery phase has not matched the intensity seen during the February selloff, implying that the current move lacks strong conviction. Buyers are present, but not aggressive enough to absorb overhead supply decisively.
From a structural standpoint, Ethereum is coiling. A clean break above $2,450 would shift momentum and open the path toward reclaiming the $2,700 region. Conversely, losing the $2,200–$2,250 support area would invalidate the higher-low structure and expose the market to a deeper retracement back toward $2,000 or lower.
Featured image from ChatGPT, chart from TradingView.com