A crypto analyst has highlighted how the Tom Demark (TD) Sequential has flashed a buy signal for XRP recently, a potential sign that a short-term rebound may be coming.
TD Sequential Has Formed A Bullish Setup For XRP
In a new post on X, analyst Ali Martinez has talked about a TD Sequential signal that has appeared on the 4-hour price of XRP. The TD Sequential here refers to an indicator from technical analysis (TA) that’s generally used for spotting trend reversals in the asset’s price. It involve two phases, but in the context of the current discussion, the first phase called the setup is the one of relevance.
During the setup, the TD Sequential counts candles of the same color up to nine. Once the nine candles are in, the indicator gives the signal for a potential reversal. Naturally, the signal is a bullish one if the setup finished after nine red candles while it’s a bearish one if green candles were involved.
Now, here is the chart shared by Martinez that shows the TD Sequential setup that has appeared in the 4-hour price of XRP:
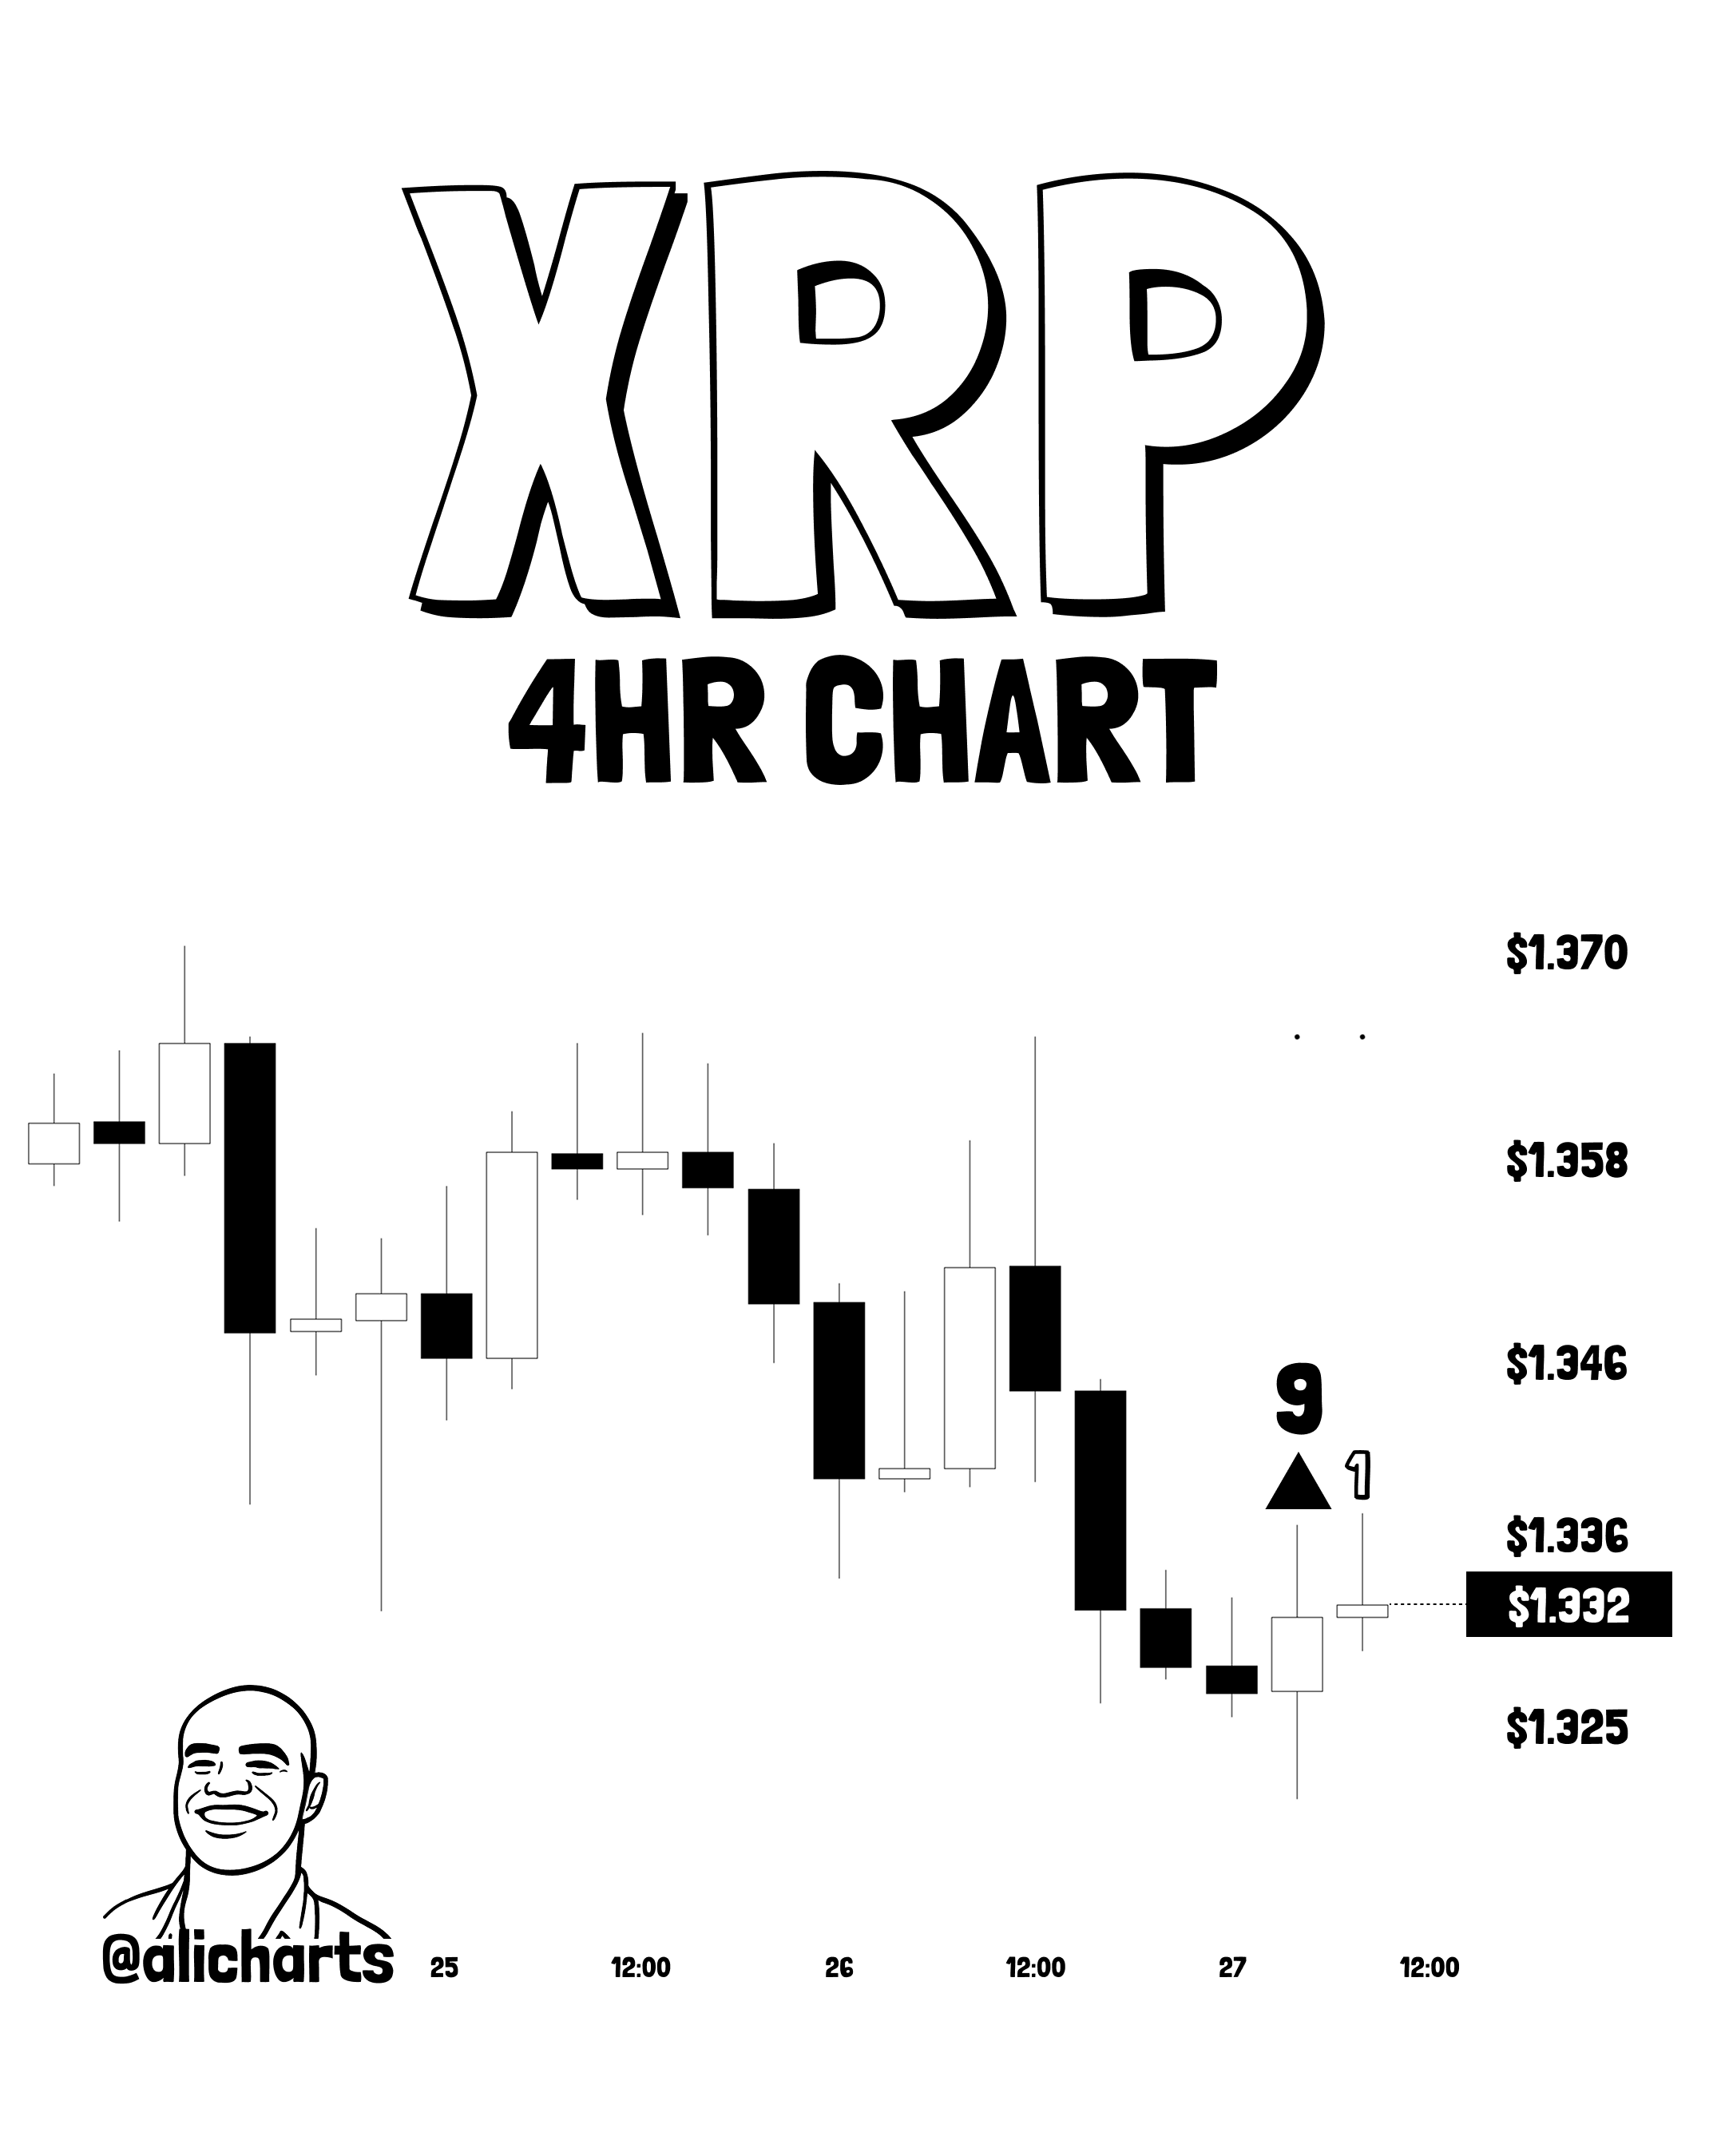
As displayed in the above graph, a downtrend in the price has led to the formation of this TD Sequential setup. Thus, the indicator is now flashing a buy signal for XRP. “I think a rebound toward $1.35 could come before trend continuation,” noted Martinez. It now remains to be seen how the asset’s price will develop in the coming days, given this signal.
In some other news, the recent XRP buyers are currently in an immense degree of pain, as on-chain analytics firm Santiment has highlighted in an X post . The metric cited by Santiment is the Market Value to Realized Value (MVRV) Ratio , which is a popular indicator that tracks the profit-loss status of the investors or addresses on the network as a whole.
As the below chart shared by the analytics firm shared by the analytics firm shows, the 30-day version of this metric, which tracks the profit-loss status of the buyers from the past 30 days, has dipped deep into the negative zone recently.
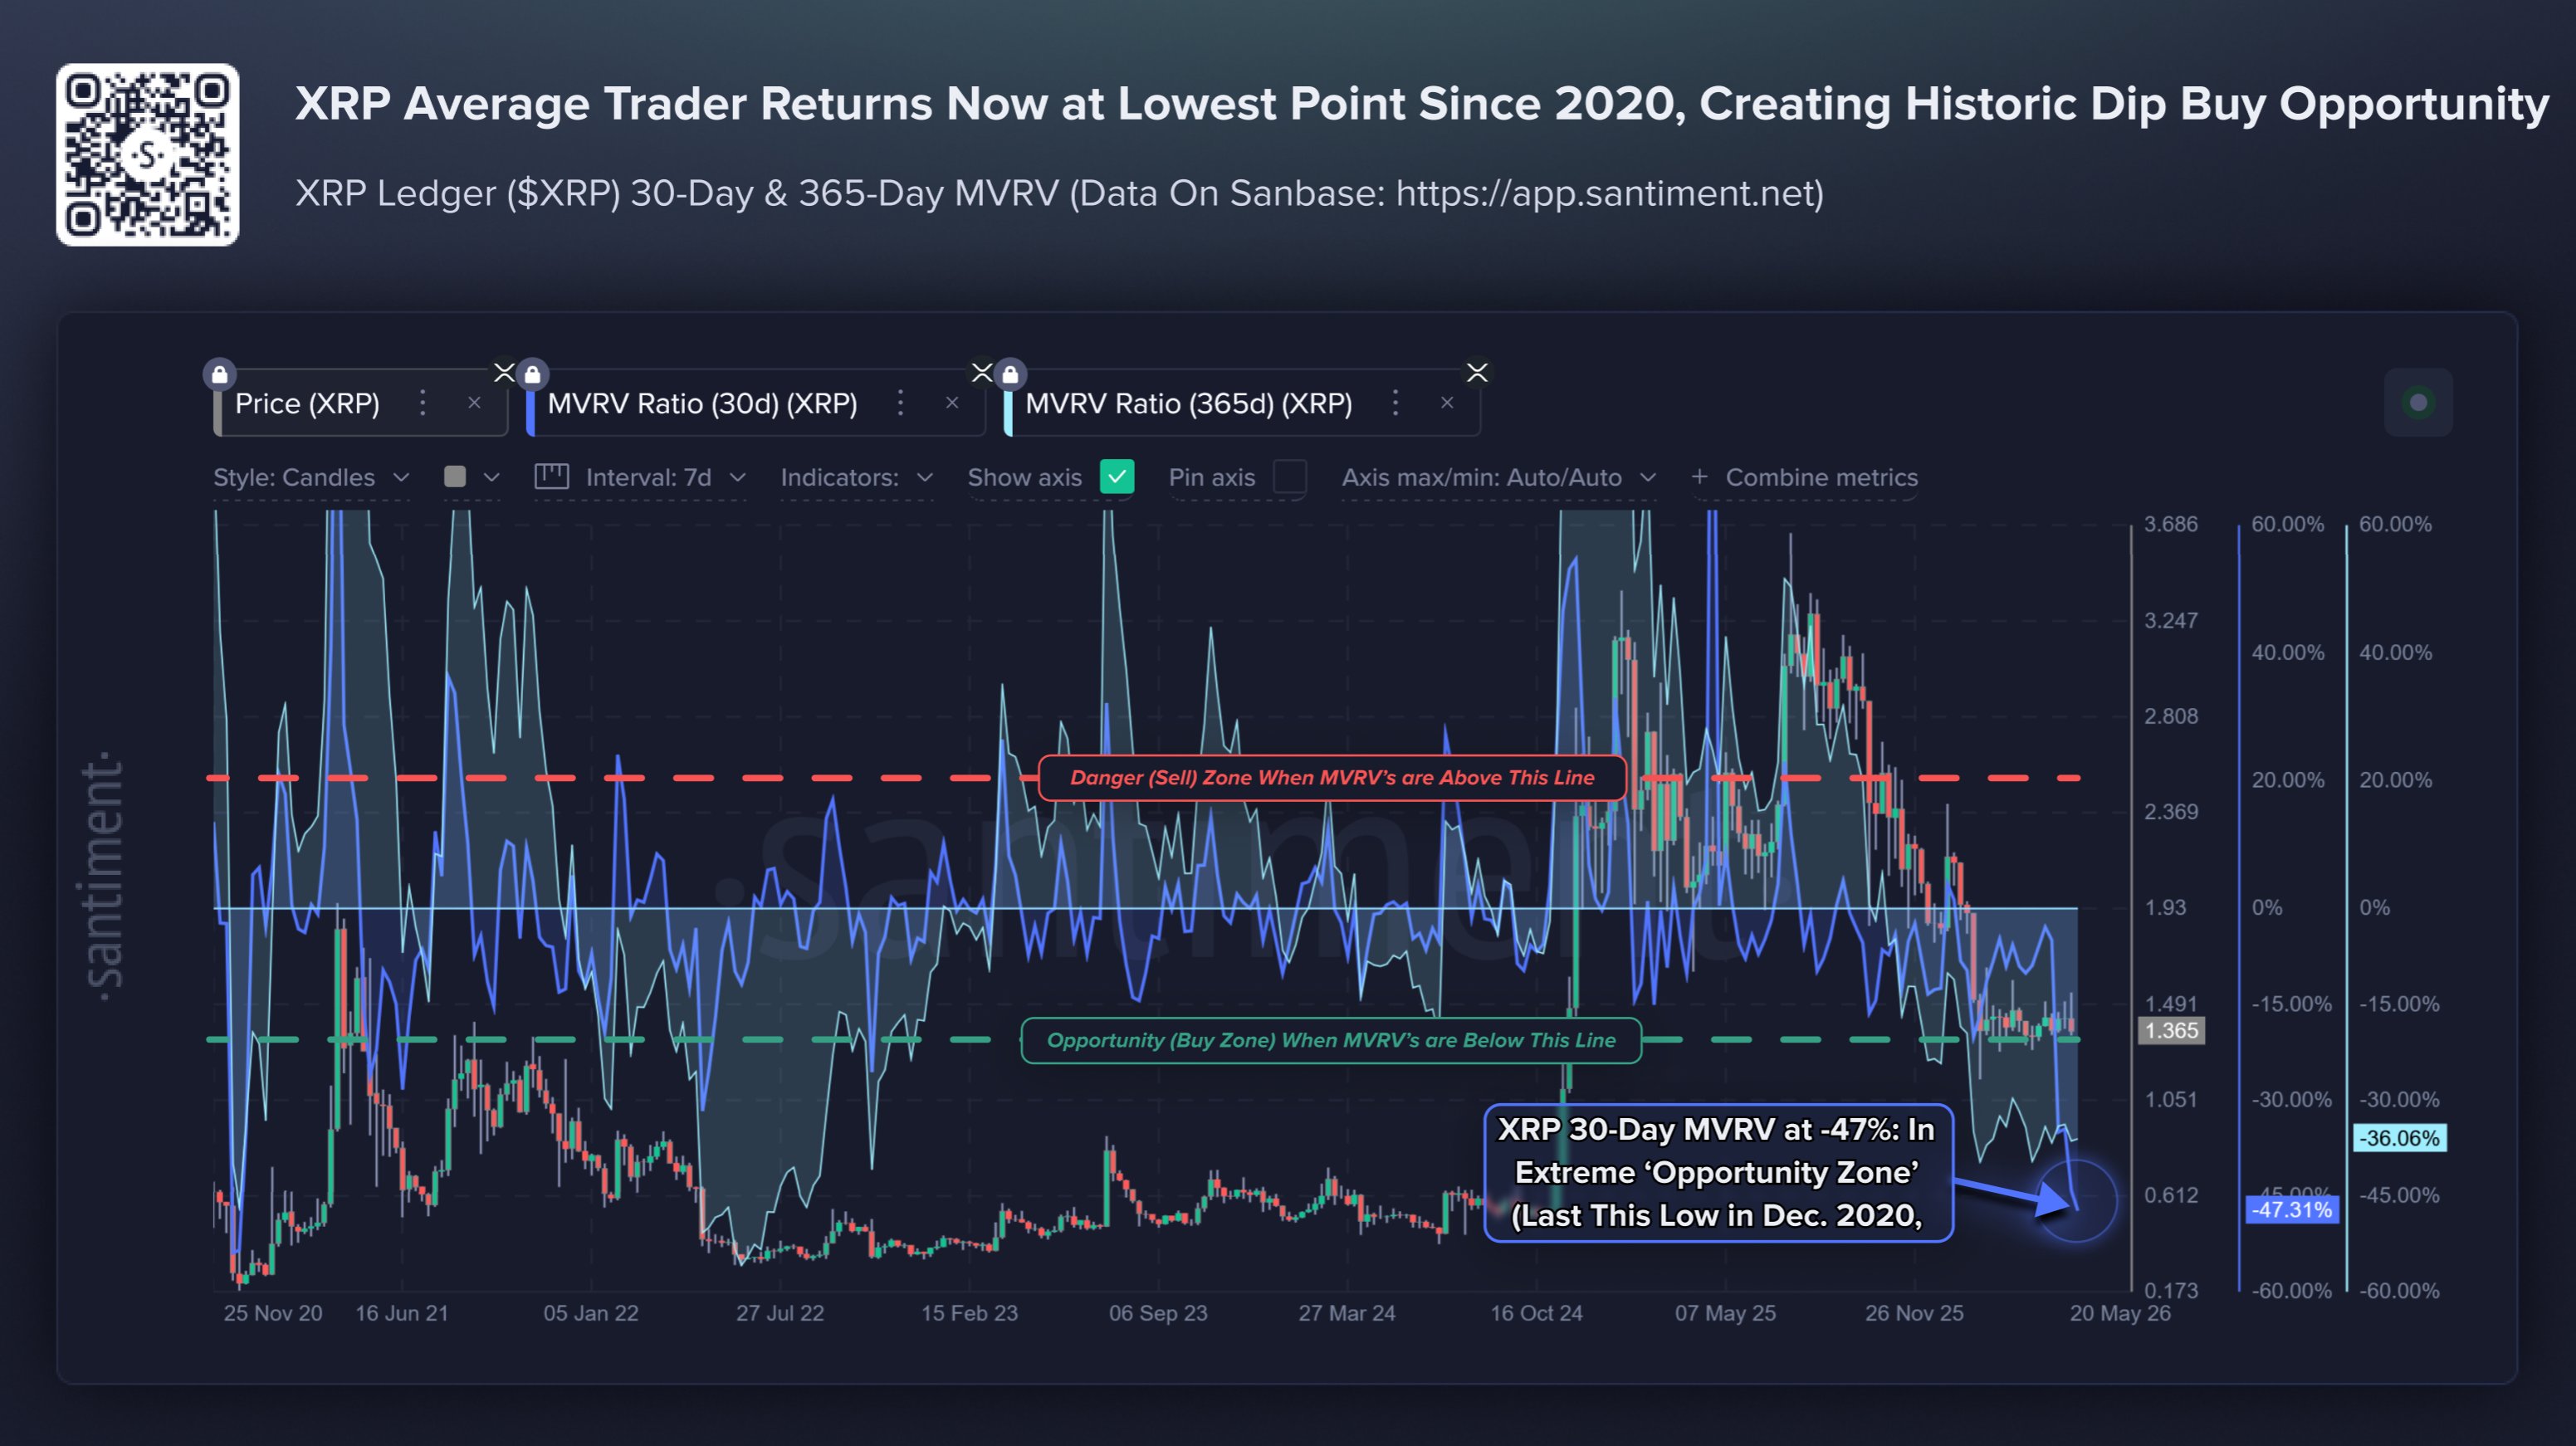
Following the sharp decline in the indicator, the average XRP buyer from the past month is in an unrealized loss of more than 47%, which is the lowest that the indicator has been since December 2020. “Historically, MVRV’s (average trading returns) will always average out to 0%, making this current time an extreme undervalued zone for XRP,” explained Santiment.
XRP Price
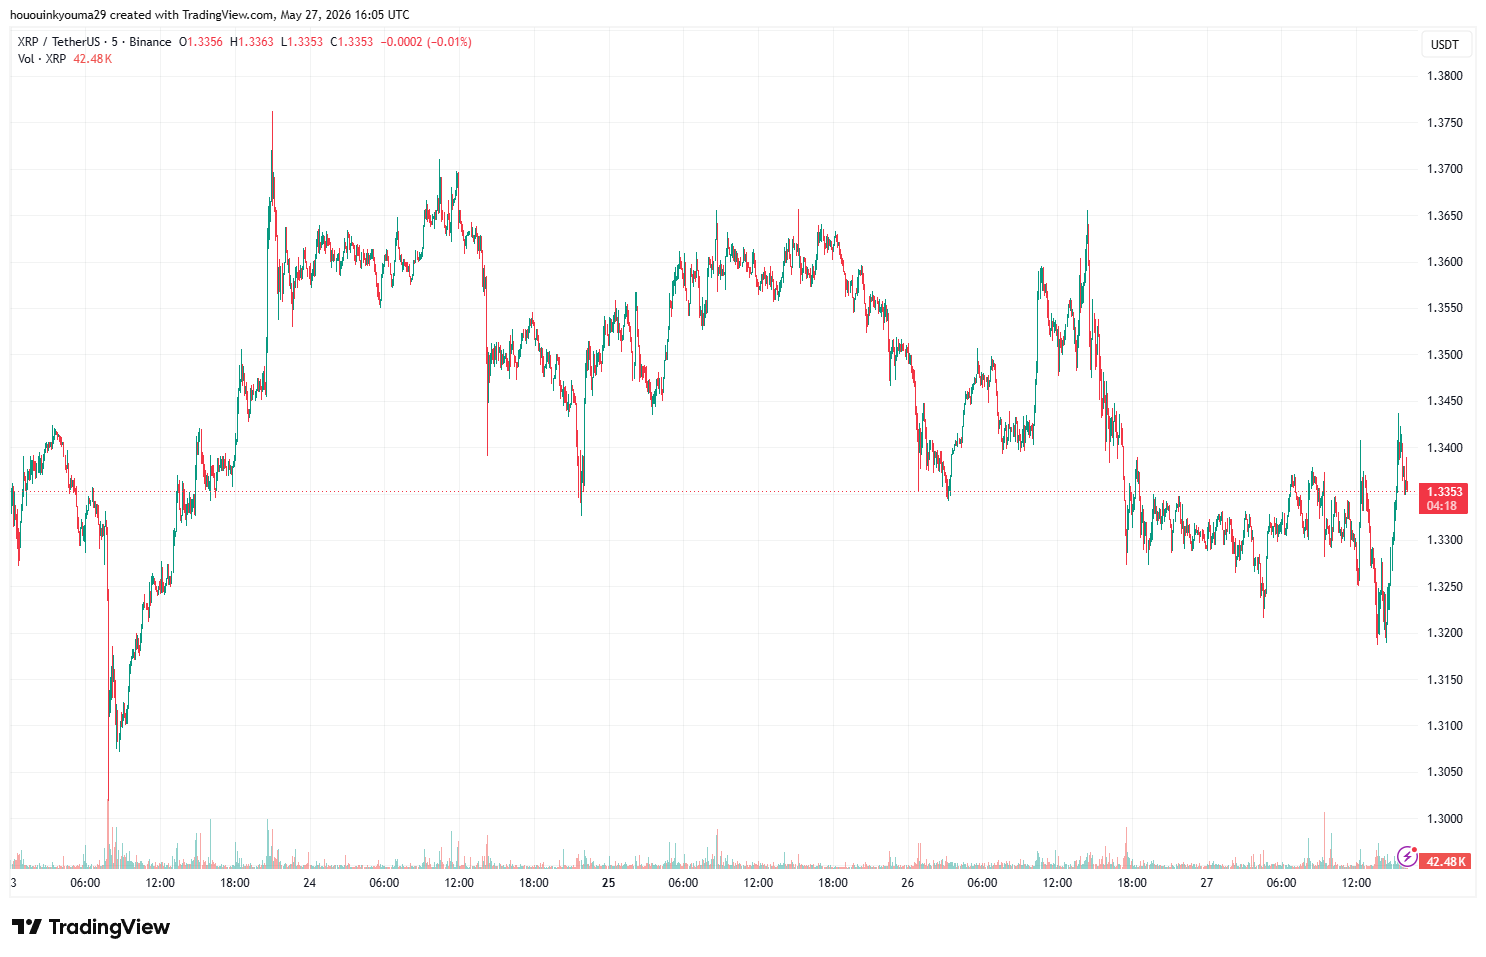
XRP has been stuck in consolidation recently as its price is trading around the $1.33 level.