The latest move saw XRP price today reclaim the $1.28 level for the first time in nearly two weeks. Market participants pointed to reports of easing tensions between the United States and Iran as a key catalyst behind the rally, helping restore confidence after a period of heightened uncertainty that weighed on digital assets.
The recovery comes after weeks of pressure on XRP, making the latest advance one of the asset's strongest short-term rebounds in recent months.
Whale Accumulation Supports XRP Recovery
Beyond the broader market tailwind, on-chain data suggests that large XRP holders have continued accumulating during the recent downturn.
Wallets holding at least one million XRP now control approximately 74.1% of the circulating supply, having added an estimated 1.53 billion tokens over the past six months. The sustained accumulation by large investors has been viewed as a sign of continued confidence in the long-term outlook for Ripple XRP and its ecosystem.
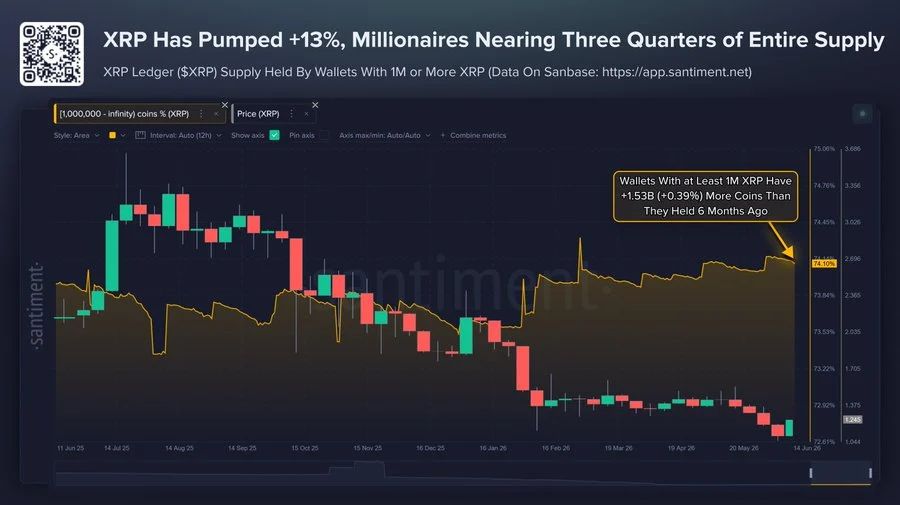
XRP rebounded above $1.28 for the first time in two weeks as easing US-Iran tensions boosted market sentiment and fueled renewed buying across the crypto sector. Source: @SantimentData via X
Market observers have also highlighted Ripple's ongoing expansion in institutional payments and tokenization initiatives on the XRP Ledger, developments that have helped support sentiment despite recent market volatility.
The combination of improving macroeconomic conditions and persistent whale buying appears to have created the foundation for the latest recovery.
XRP Breakout Places Key Resistance Levels in Focus
Technical traders have pointed to a confirmed breakout on XRP's chart after the asset pushed through several near-term resistance levels.
The token is currently testing the 200-period exponential moving average on the four-hour timeframe, an area often watched closely by traders as a major support and resistance zone. Maintaining price action above this level could strengthen the bullish case in the short term.
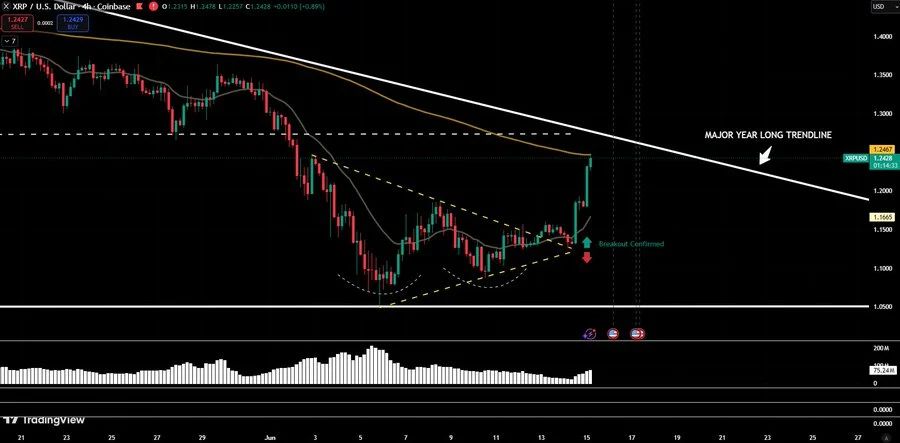
XRP has confirmed a bullish breakout on the 4-hour chart, reclaiming the 200 EMA near $1.24 and setting its sights on a major year-long descending trendline resistance. Source: Josiah Gallegos via X
Analysts are also monitoring a year-long descending trendline that continues to cap upside momentum. A decisive break above that trendline could open the door for a move toward higher resistance zones.
While sentiment has improved, traders remain cautious ahead of upcoming macroeconomic events, including comments from Federal Reserve Chair Kevin Warsh, which could influence expectations around future interest-rate policy and broader market risk appetite.
Elliott Wave Analysis Points to $1.94 Target
Adding to the bullish narrative, technical analyst @cleggzonehq recently shared an Elliott Wave update suggesting that XRP may have completed its corrective wave structure.
According to the analysis, wave (4) concluded following a wedge breakout, accompanied by a reset in momentum indicators and successful defense of a key demand zone.
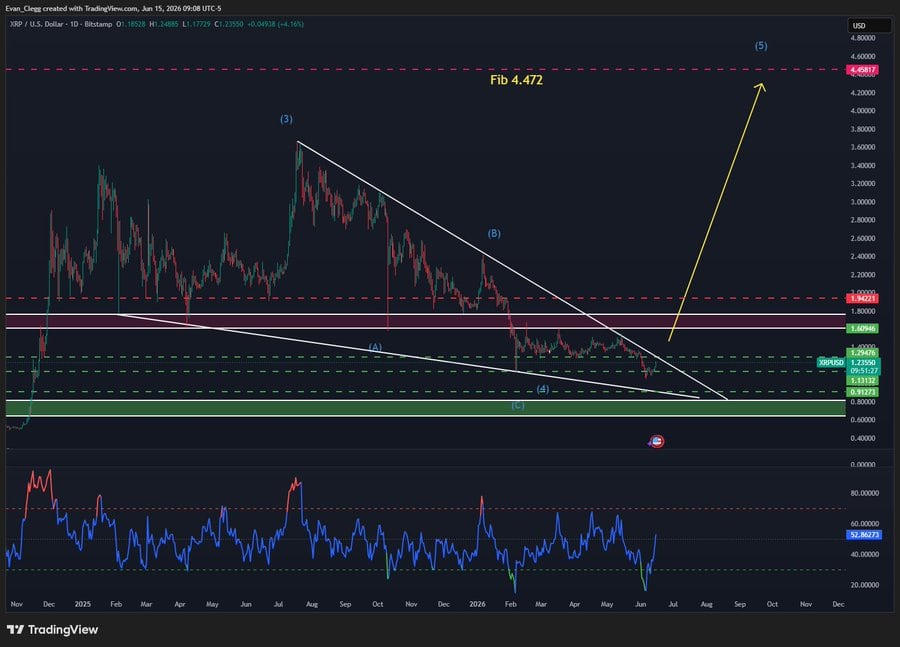
According to Elliott Wave analysis, XRP completed wave (4) following a wedge breakout, with a reset RSI and strong support holding at key demand zones around $1.24. Source: @cleggzonehq via X
The analyst projected wave (5) could eventually extend toward a Fibonacci target near $4.47. However, several resistance levels stand in the way before such a move could materialize.
The chart identifies $1.61 as an important intermediate resistance area, followed by a potential retest of $1.94. These levels are likely to attract significant trader attention if current momentum continues.
The analyst described the recent decline as a market shakeout that weakened sentiment before buyers returned to support the trend.
XRP Technical Analysis Shows Improving Momentum
At the time of analysis, XRP was trading around $1.28 after gaining nearly 8% intraday, reflecting a noticeable improvement in short-term momentum.
Several technical indicators are beginning to turn constructive. The Relative Strength Index (RSI-14) sits at 56.14, indicating neutral conditions while remaining comfortably below overbought territory. The Stochastic %K stands at 58.94, while the Commodity Channel Index (CCI-20) reads 40.33, both signaling balanced market conditions.
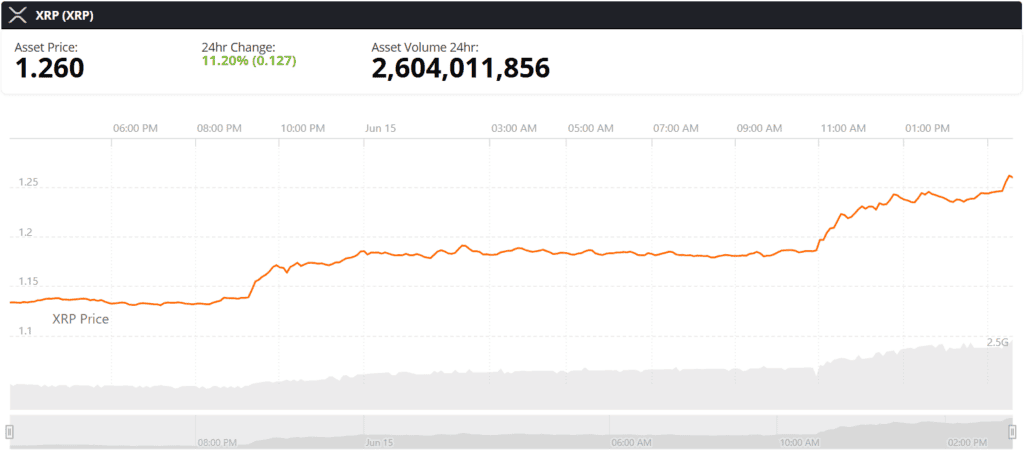
XRP was trading at around $1.26 at press time. Source: XRP price via Brave New Coin
Trend strength appears to be improving as well. The Average Directional Index (ADX-14) measures 34.25 and currently generates a buy signal. Momentum (10) has moved to +0.18808, while the MACD indicator also shows a bullish reading despite remaining slightly negative at -0.04328.
Overall, oscillators produce three buy signals and eight neutral readings, suggesting that upward momentum is building without the market becoming excessively overheated.
Major Resistance Remains Ahead
Moving averages present a more mixed picture. Short-term indicators remain supportive, with the 10-period EMA at 1.18409 and the 20-period EMA at 1.21086 both signaling continued strength. The 30-period EMA at 1.24184 also remains below the current market price .
However, longer-term moving averages continue to highlight the broader downtrend. The 50-period moving averages near 1.29–1.32 have shifted to sell signals, while the 100-period and 200-period averages between 1.35 and 1.58 remain significant overhead resistance zones.
TradingView's aggregate technical summary currently shows 11 buy signals, nine neutral readings, and six sell signals, resulting in an overall "Buy" assessment for the selected timeframe.
From a support and resistance perspective, the central pivot level is located at $1.3817. Immediate resistance sits near $1.4989, followed by $1.6669. A stronger breakout could eventually place the $1.9521 region into focus, aligning closely with the widely watched $1.94 target identified by Elliott Wave analysis.
For now, the XRP price prediction remains dependent on whether buyers can maintain momentum above key moving averages while successfully overcoming resistance levels that have capped previous rallies. A sustained move above $1.50 could strengthen the case for a broader advance, while failure to hold current gains may return attention to support near $1.21.