
BGC
#1310
BGC Group, Inc. - Class A Common Stock
10.9 4 USD
0.00%
Sektor: Finanzen
Basis: USD
Gewinnwährung: USD
Tagesspanne
Jahresspanne
Tagesänderung
-0.36%
Monatliche Änderung
-8.30%
6 month change
+22.37%
Jahresänderung
+7.36%
Vorheriger Schlusskurs
10.9 8
Open
10.9 4
Tief
10.9 4
High
10.9 4
Volumen
233
Financials
Wert Q1, 25Q2, 25Q3, 25Q4, 25Q1, 26 Current
Key stats
Valuation ratios
Profitability ratios
Liquidity ratios
Solvency ratios
Per share metrics
Nachrichten
BGC Group startet neuen Geschäftsbereich für den Handel mit Rechenkapazität
Bank of America stuft BGC vor Investorentreffen als Top-KI-Aktie im Kapitalmarktsektor ein
BGC mit Rekordergebnis im ersten Quartal 2026: ECS-Sparte und Technologieplattformen treiben Wachstum
BGC Group vor Quartalszahlen: Setzt sich der Wachstumskurs von 37 % fort?
Bgc Group: Aktie markiert neues 52-Wochen-Hoch bei 11,80 USD
BGC Group-Aktie markiert 52-Wochen-Hoch bei 10,97 USD
Bgc Group: EPS übertrifft Schätzungen um 0,02 $ - Umsatz besser als erwartet
Abseits von Nvidia & AMD: 16 unterschätzte Aktien-Chancen
BGC Group Q3 2025: Umsatz steigt um 31 % – Elektronische Plattformen gewinnen Marktanteile
Bgc Group: EPS übertrifft Schätzungen - Umsatz besser als erwartet
BGC Group im Q2 2025: Rekordumsätze steigen dank elektronischem Handel um 42 %
Charts & Ideen
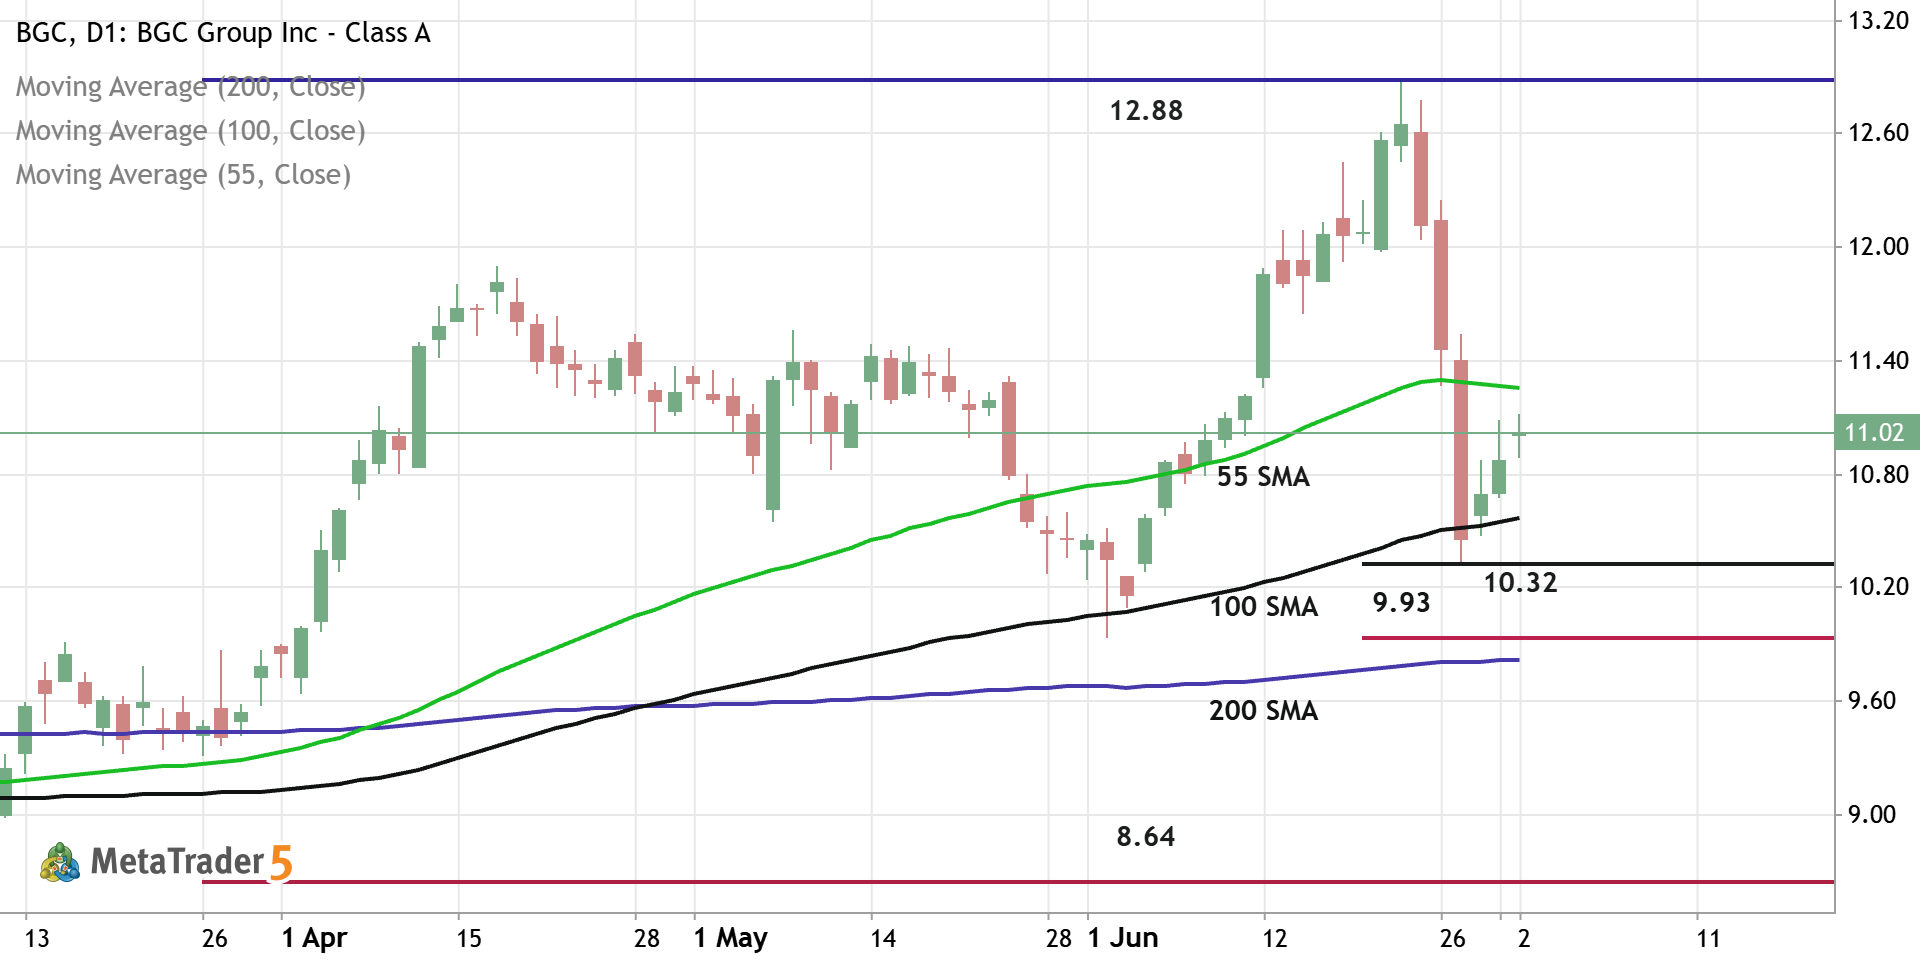
BGC - Daily Trading Forecast
Daily price is located above 200-SMA in the bullish area of the chart. The price was bounced from support level at 10.32 and from 100-SMA to above for the pimary bullish trend to be continuing. If the price breaks 55-SMA to above so the strong bullish trend will be resumed with 12.88 resistance as the global possible target. If the price crosses support level at 9.93 together with 200-SMA to below so the primary bearish reversal will be started with 8.64 support level as the global possible target. Aternatively, the price will be on secondary ranging to be near and above 200 SMA waiting for direction. Trading Summary : waiting for direction
0 

The BGC doesn’t have other trading ideas at this time
Browse ready-made trading ideas or select a symbol and create your own
Go to Charts and Trading Ideas