
BGC
#1310
BGC Group, Inc. - Class A Common Stock
10.9 4 USD
0.00%
Settore: Finanziario
Base: USD
Valuta di Profitto: USD
Intervallo Giornaliero
Intervallo Annuale
Variazione giornaliera
-0.36%
Variazione Mensile
-8.30%
Variazione di 6 mesi
+22.37%
Variazione Annuale
+7.36%
Chiusura Precedente
10.9 8
Open
10.9 4
Minimo
10.9 4
High
10.9 4
Volume
233
Financials
Valore Q1, 25Q2, 25Q3, 25Q4, 25Q1, 26 Current
Key stats
Valuation ratios
Profitability ratios
Liquidity ratios
Solvency ratios
Per share metrics
Notizie
BGC Group lancia una divisione per i mercati delle infrastrutture di calcolo
Il titolo azionario di Virtu Financial raggiunge il massimo storico a 52,21 USD
Bank of America indica BGC come miglior titolo AI nei mercati dei capitali
BGC Q1 2026: utili record grazie al balzo dell’ECS e ai guadagni tech
BGC Group: può continuare la crescita del 37%?
Le azioni di Bgc Group raggiungono il massimo a 52 settimane a 11,8 USD
Il titolo di BGC Group raggiunge il massimo di 52 settimane a 10,97 USD
Gli EPS di Bgc Group hanno battuto le aspettative per 0,02$, il fatturato supera le previsioni
BGC riconferma le previsioni per il Q4 2025
BGC Group venderà kACE Financial a smartTrade per un valore fino a 119 milioni di dollari
BofA elenca 16 opportunità azionarie al di fuori dell’AI
Grafici & Idee
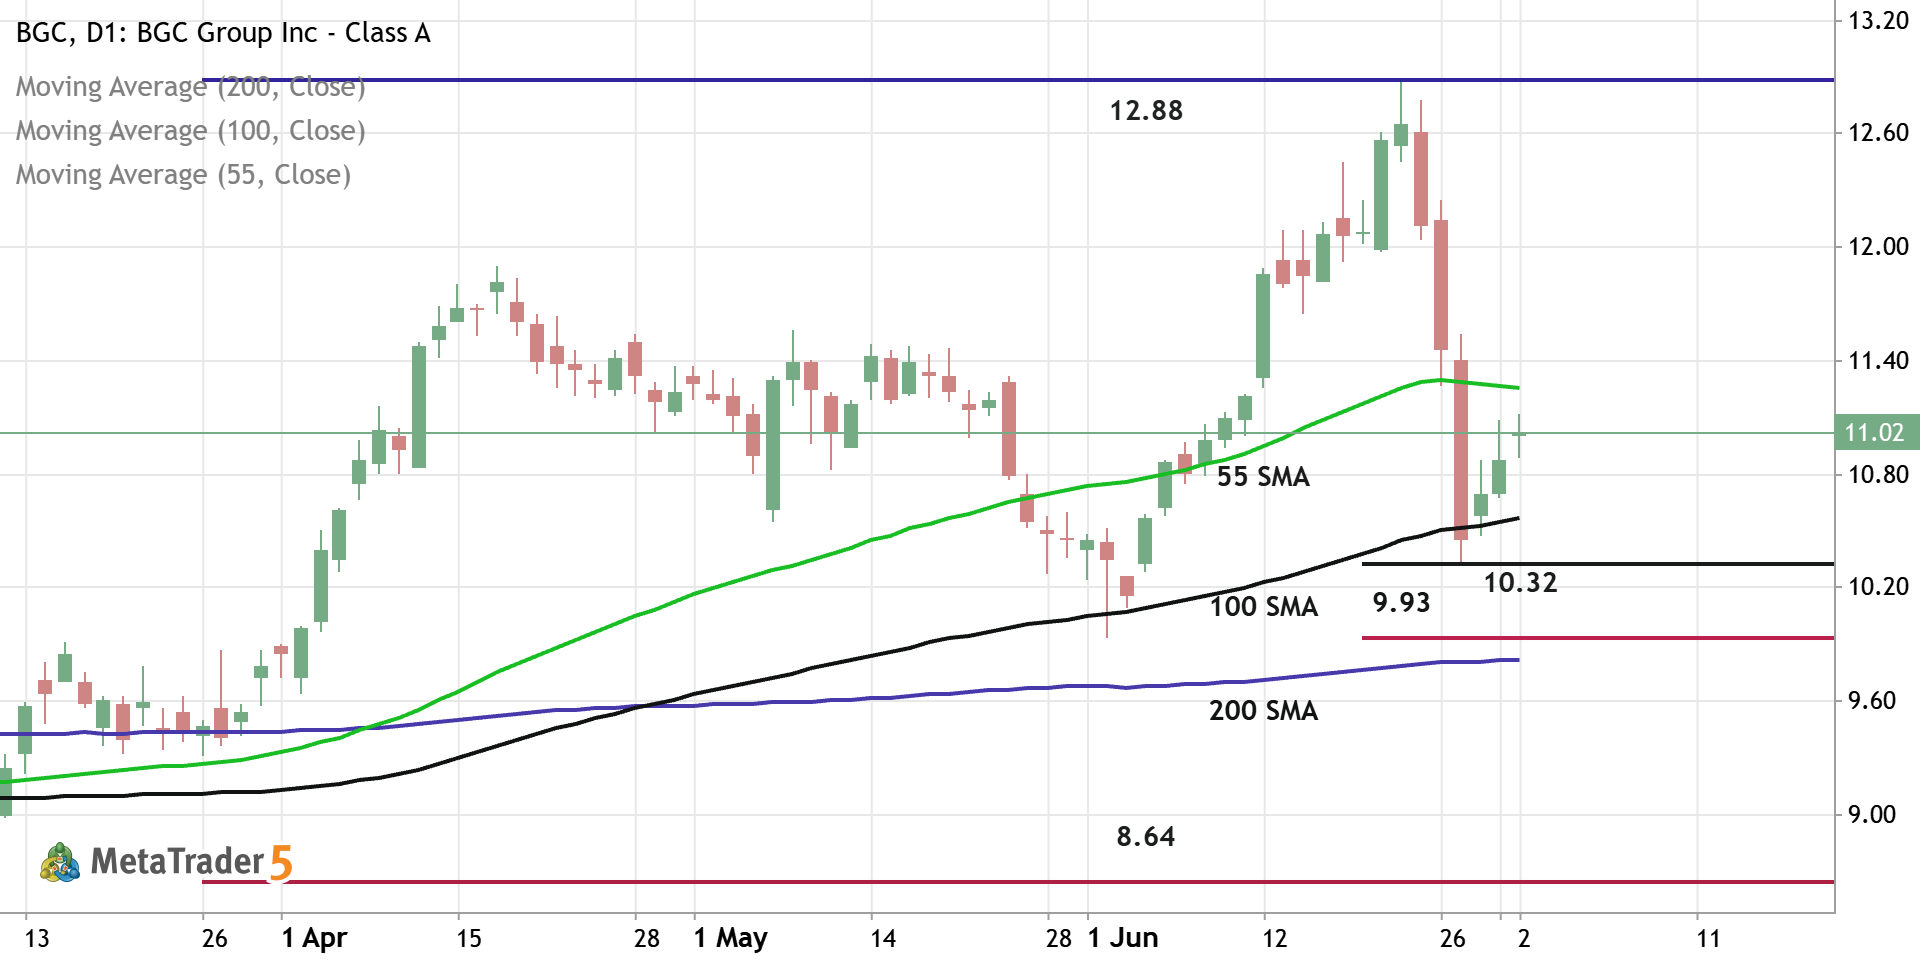
BGC - Daily Trading Forecast
Daily price is located above 200-SMA in the bullish area of the chart. The price was bounced from support level at 10.32 and from 100-SMA to above for the pimary bullish trend to be continuing. If the price breaks 55-SMA to above so the strong bullish trend will be resumed with 12.88 resistance as the global possible target. If the price crosses support level at 9.93 together with 200-SMA to below so the primary bearish reversal will be started with 8.64 support level as the global possible target. Aternatively, the price will be on secondary ranging to be near and above 200 SMA waiting for direction. Trading Summary : waiting for direction
0 

The BGC doesn’t have other trading ideas at this time
Browse ready-made trading ideas or select a symbol and create your own
Go to Charts and Trading Ideas