BTCUSD H4 ANALYSIS BTCUSD Bitcoin vs US Dollar
BTCUSD H4 ANALYSIS
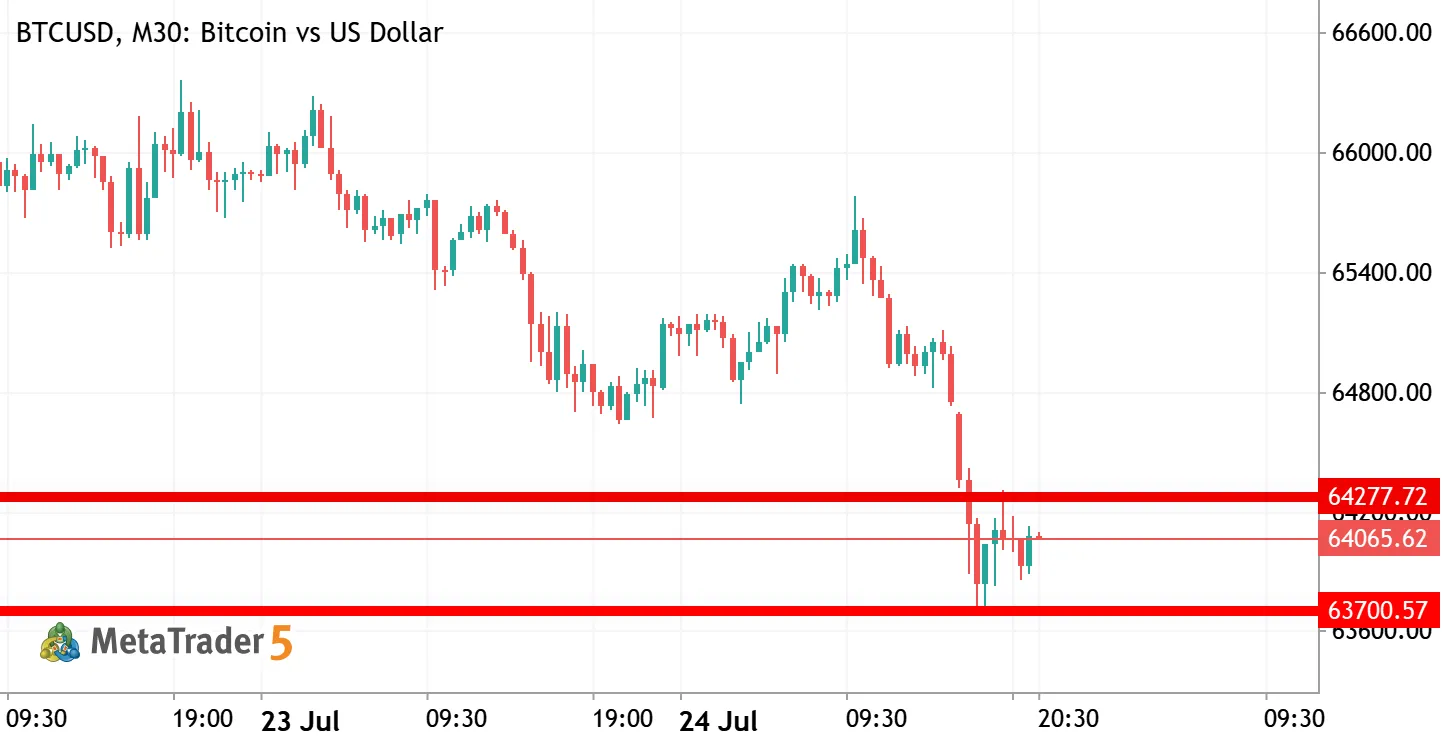
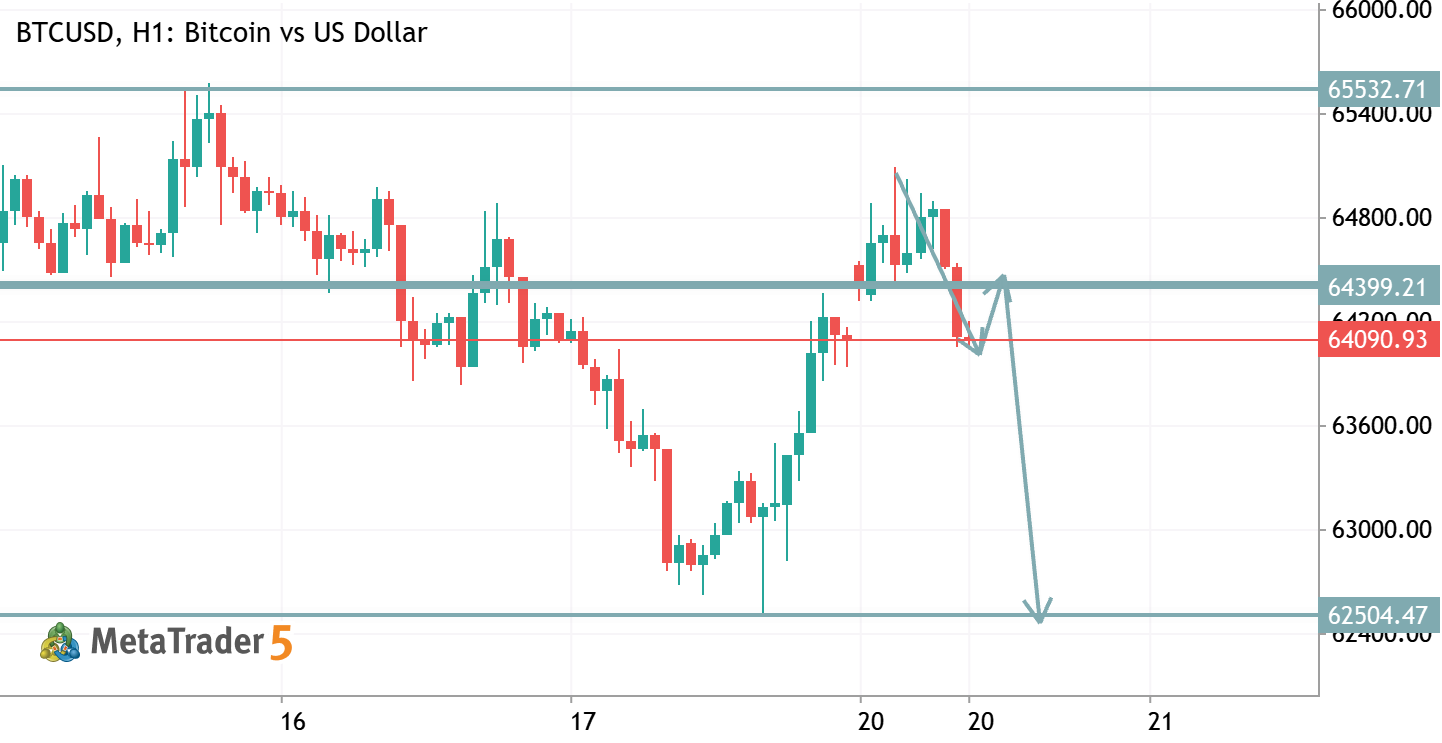
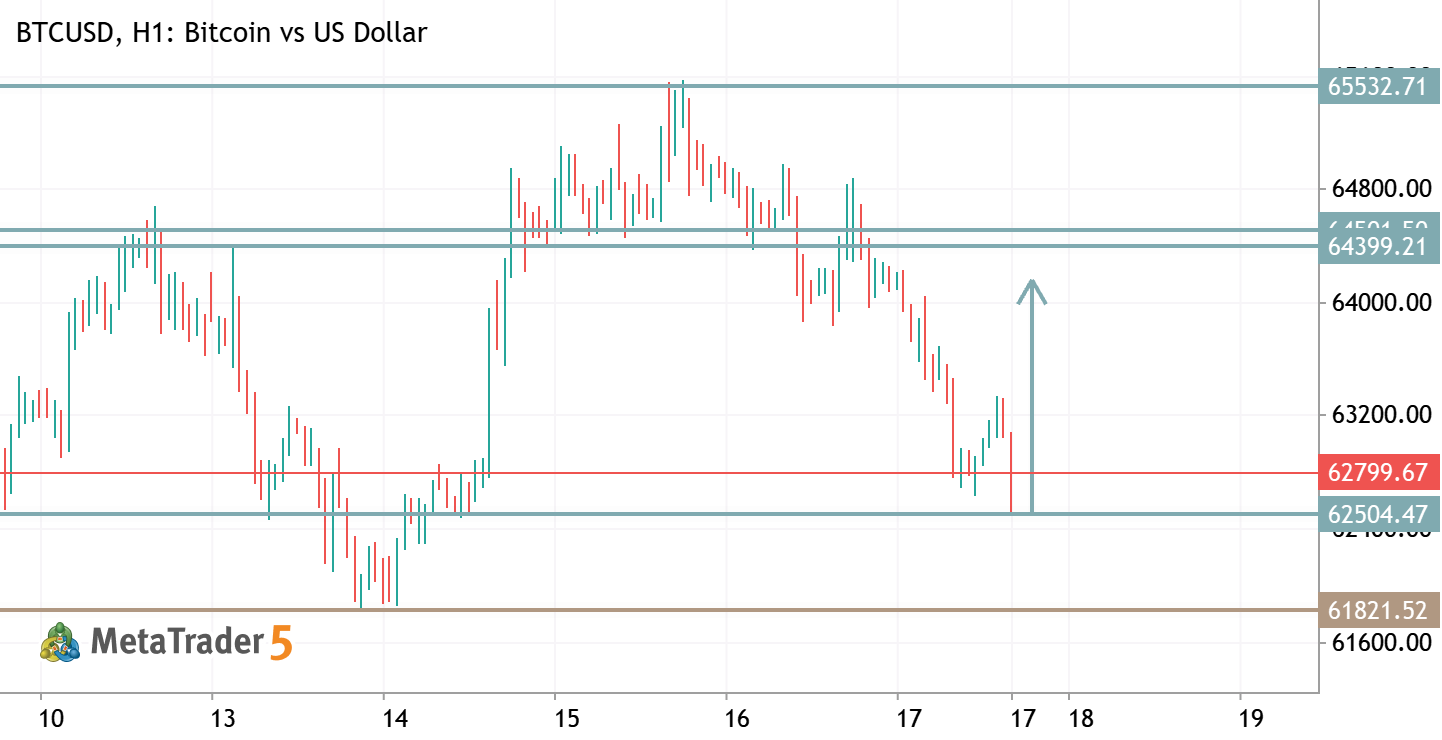
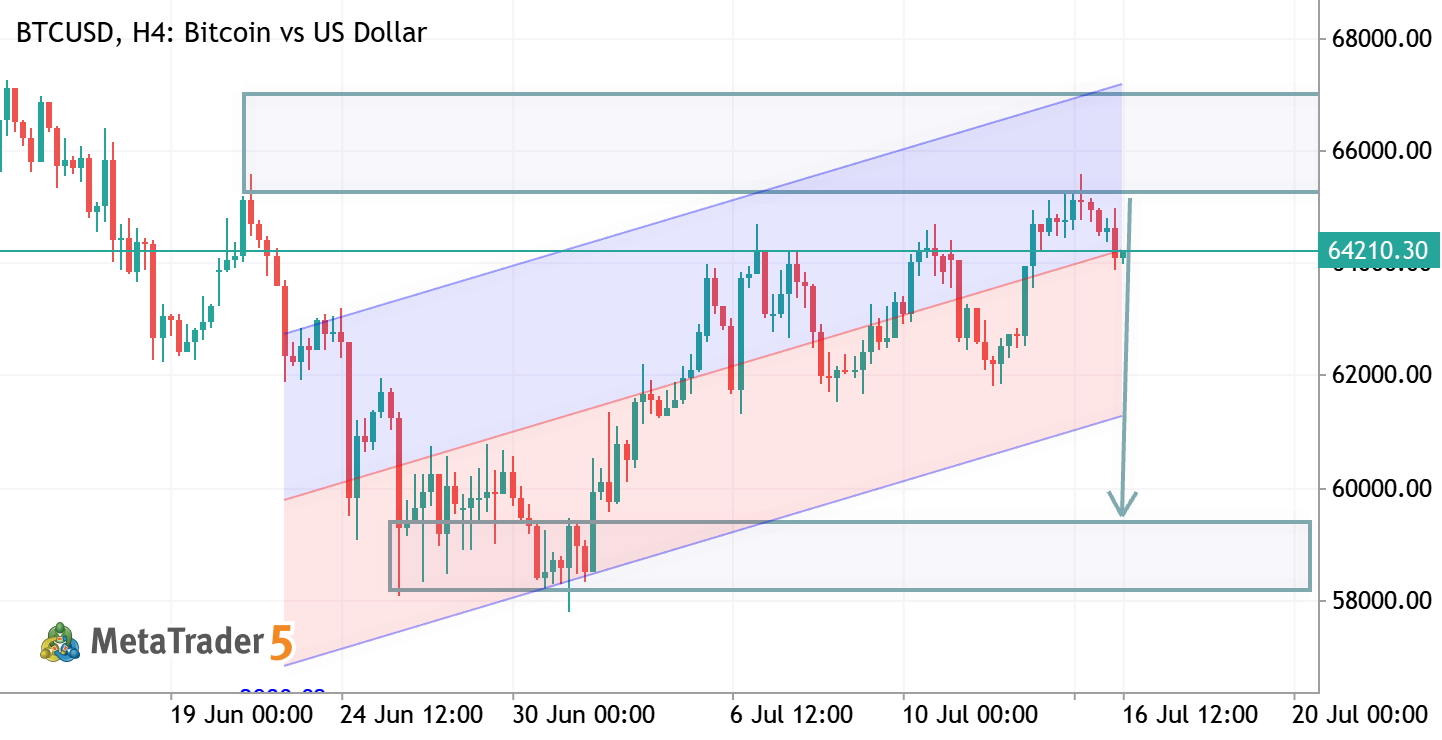
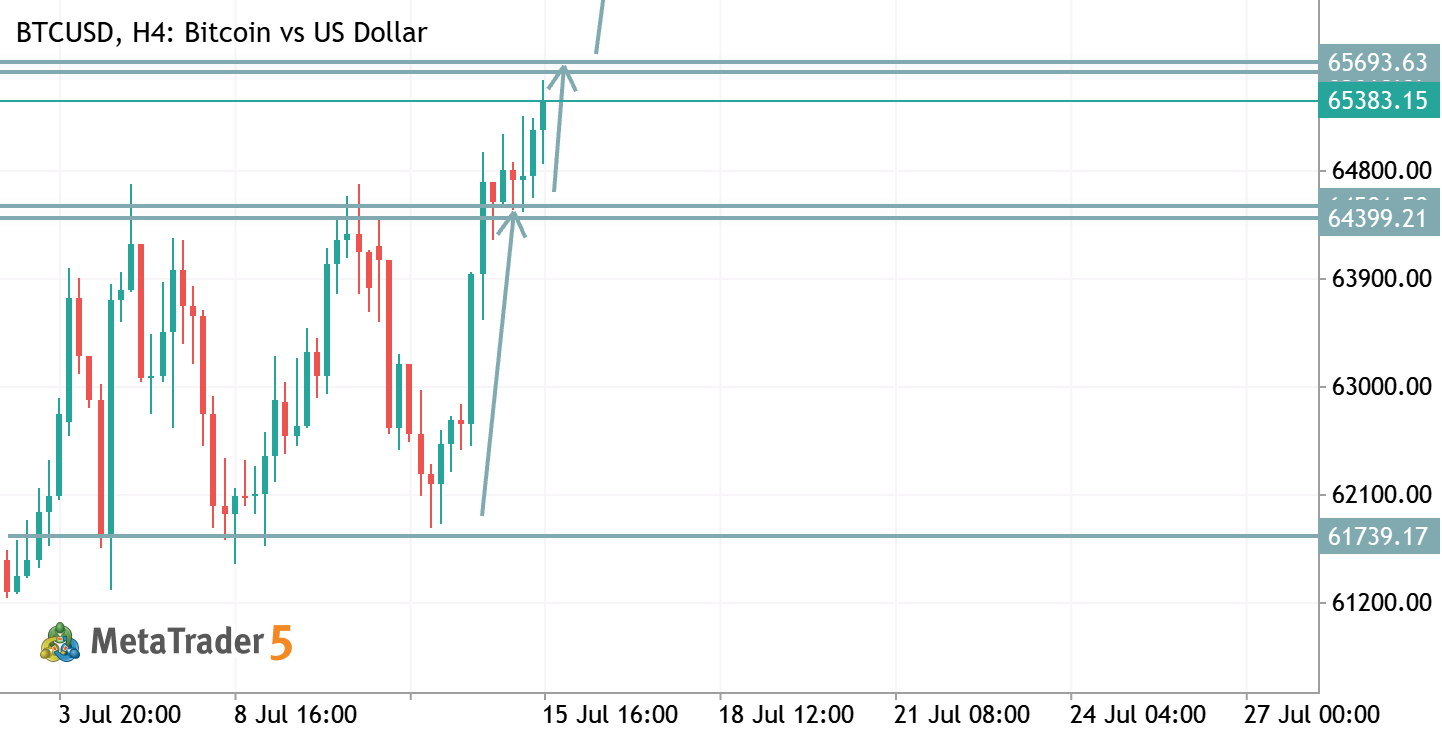
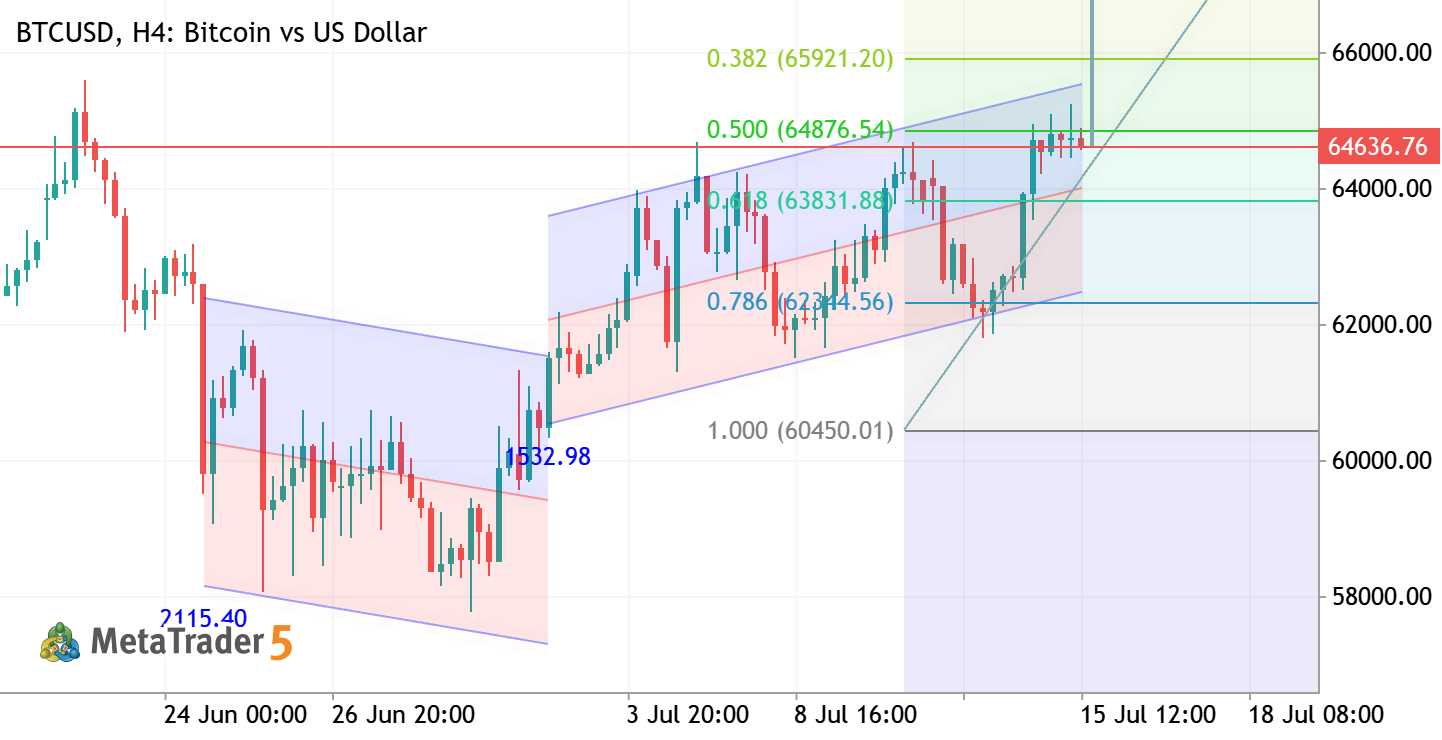
BTCUSD | H4 Analysis Bitcoin is showing signs of accumulation near a major support zone after an extended bearish channel. Price is testing the lower trendline, and a breakout from the current structure could trigger a strong bullish recovery toward 76,000 – 78,000. 📈 Bullish Scenario: Sustained buying above support may push BTC toward higher resistance levels and confirm trend reversal. 📉 Bearish Scenario: Failure to hold support could extend the correction before the next bullish leg develops. Bias: Bullish while support holds. Watch for breakout confirmation before targeting upper resistance zones. #BTCUSD #Bitcoin #Crypto #TechnicalAnalysis #MQL5 #TradingView
5
Goldanalysisteam Abdul Qayoom 2026.06.01 06:29
BTCUSD TRADE IDEA BTCUSD Bitcoin vs US Dollar
BTCUSD TRADE IDEA
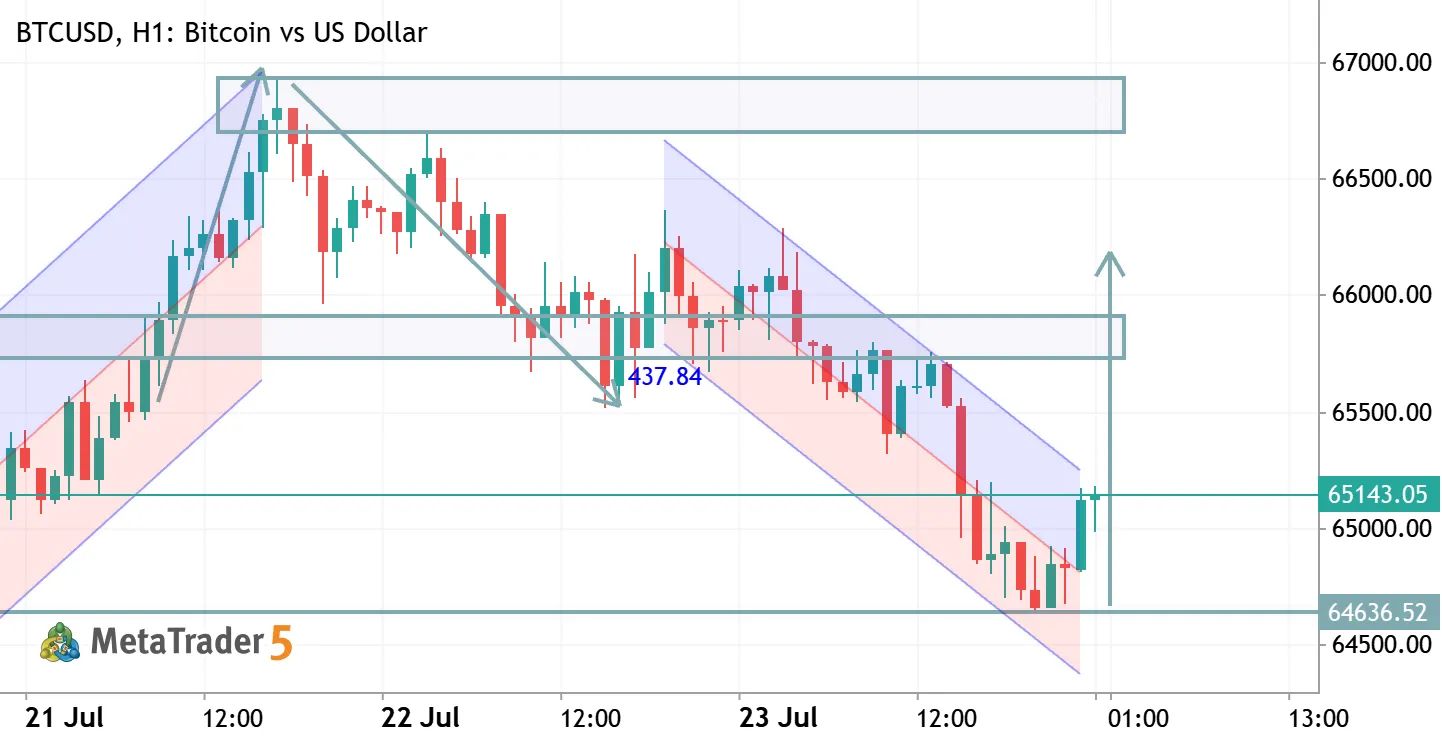
Market Structure: Bearish to neutral BTCUSD has been in a clear short-term downtrend since the rejection from the 82,000 area. Price broke below the 75,400 support zone , confirming bearish momentum. The recent bounce from 73,600 support appears to be a corrective retracement rather than a confirmed trend reversal. Key Levels 🔹 Resistance 75,400 – 75,500 (previous support turned resistance) 77,370 (major supply zone) 🔹 Support 73,600 (current support) 70,900 (next major downside target) Trading Scenarios Bullish Scenario If BTC closes strongly above 75,400 , buyers could push price toward 77,370 . A breakout above 77,370 would improve the medium-term outlook and could target higher highs. Bearish Scenario Failure to reclaim 75,400 may attract sellers. A break below 73,600 would likely
0
HamadJatoi Hamad Jatoi 2026.05.31 20:14
BTCUSD TRADE IDEA BTCUSD Bitcoin vs US Dollar
BTCUSD TRADE IDEA
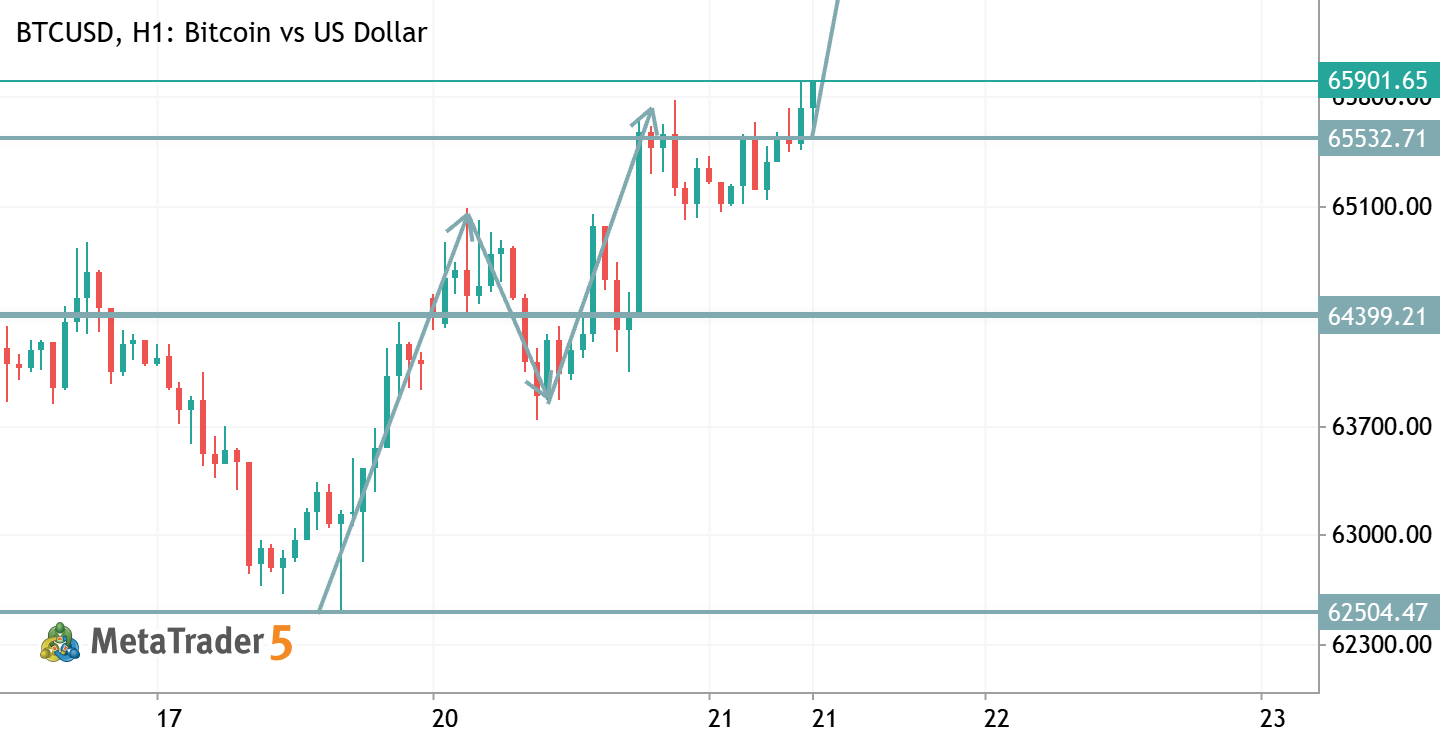
BTCUSD is trading near a major H4 support zone around 74,900 – 75,400 after a strong bearish breakdown from the 77,300 resistance area. The chart shows price rejecting multiple supply zones and losing bullish momentum, confirming short-term bearish pressure. The current move is testing a key ascending trendline support. A clean break below 74,900 could trigger a continuation sell-off toward 72,900 , followed by the major support around 70,400 . This area also aligns with the lower Fibonacci retracement zone, making it an important target for sellers. On the upside, if BTC holds above the trendline and reclaims 77,300 , buyers may attempt a recovery toward 78,800 – 79,500 resistance. However, overall structure remains weak unless price closes back above the upper supply zone. Key Levels
3
HamadJatoi Hamad Jatoi 2026.05.27 19:58
BTCUSD TRADE IDEA BTCUSD Short Bitcoin vs US Dollar
BTCUSD TRADE IDEA
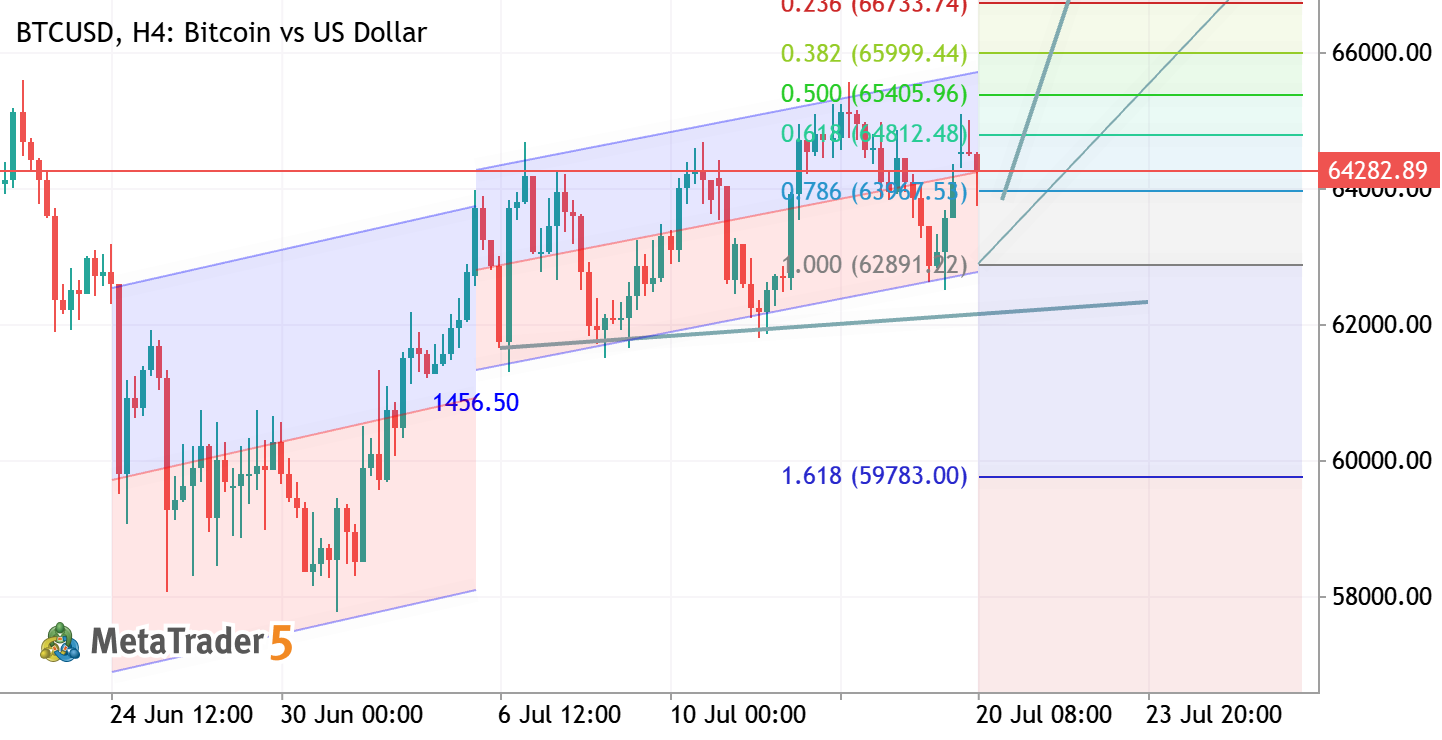
BTCUSD is currently trading inside a short-term consolidation range after a strong bearish correction from the 81K resistance zone. Price reacted sharply from the supply area near 79,000–80,000 and dropped toward the key support around 75,500. The market structure on H4 remains bearish-to-neutral while price stays below the 77,850 resistance zone. Multiple rejections from this level show weak bullish momentum and possible continuation to the downside. Key Levels: Resistance: 77,850 → 80,600 Support: 75,500 Bearish Scenario: If BTCUSD fails to break and close above 77,850, sellers may push price back toward 75,500 support. A breakdown below 75,500 could open the path toward 74,000 and lower. Bullish Scenario: A strong H4 close above 77,850 may trigger recovery momentum toward 79,000 and
0
HamadJatoi Hamad Jatoi 2026.05.25 19:35
BTC LONG TERM TARGET BTCUSD Long Bitcoin vs US Dollar
BTC LONG TERM TARGET
Bitcoin is expected to maintain strong long-term growth potential due to increasing global adoption, institutional investment, and limited supply. Many analysts believe that if demand continues to rise over the coming years, Bitcoin could potentially reach the ₹1.4 crore ($140,000+) price range in the long term. However, the cryptocurrency market remains highly volatile, and investors should always manage risk carefully before making financial decisions.
1
s Sheeba Taj 2026.05.20 15:02
btcusd h4 analysis BTCUSD Bitcoin vs US Dollar
btcusd h4 analysis
BTCUSD H4 Analysis 📉 Market rejected from the rising channel resistance and broke structure to the downside. Price is now consolidating near key support after strong bearish momentum. 🔹 Support Zone: 72400 – 73000 🔹 Resistance Zone: 76100 – 77300 🔹 Bias: Bearish below resistance Possible scenario: A weak retest can happen before continuation toward lower liquidity zones. Sellers still control the market unless price reclaims the broken structure. ⚡ #BTCUSD #Bitcoin #Forex #Crypto #PriceAction #SmartMoney
0
Goldanalysisteam Abdul Qayoom 2026.05.20 09:10
BTCUSD TRADE IDEA BTCUSD Long Bitcoin vs US Dollar
BTCUSD TRADE IDEA
BTCUSD is trading inside a bullish ascending channel on the H4 timeframe, maintaining overall bullish market structure. Price recently reacted from the 79,250–79,300 demand zone and is now consolidating around the 80,300–80,900 support/resistance region. The current price action suggests a bullish continuation setup after a corrective pullback. As long as BTC holds above 80,300, buyers remain in control with potential upside targets at 82,000 and 84,000. A breakout and strong candle close above 82,034 would confirm continuation toward the upper channel resistance near 84,000. However, failure to hold 80,300 could trigger another retest of the 79,250 support zone before bullish momentum resumes. Bias: Bullish Key Support: 80,300 → 79,250 Key Resistance: 82,034 → 84,000 Preferred Setup: Buy
0
HamadJatoi Hamad Jatoi 2026.05.12 12:54