XRP podría estar entrando en una fase más constructiva, según un nuevo hilo en X del analista de mercado Ali Martinez (@alicharts), quien argumentó el 21 de abril en X que el activo está mostrando un “cambio estructural de tendencia de bajista a alcista”. El caso se basa en una combinación de indicadores de seguimiento de tendencias, acumulación de ballenas, dinámicas de suministro en exchanges y una estructura de gráfico que se está estrechando y que podría preparar un movimiento mayor.
4 Señales de que XRP se está volviendo alcista
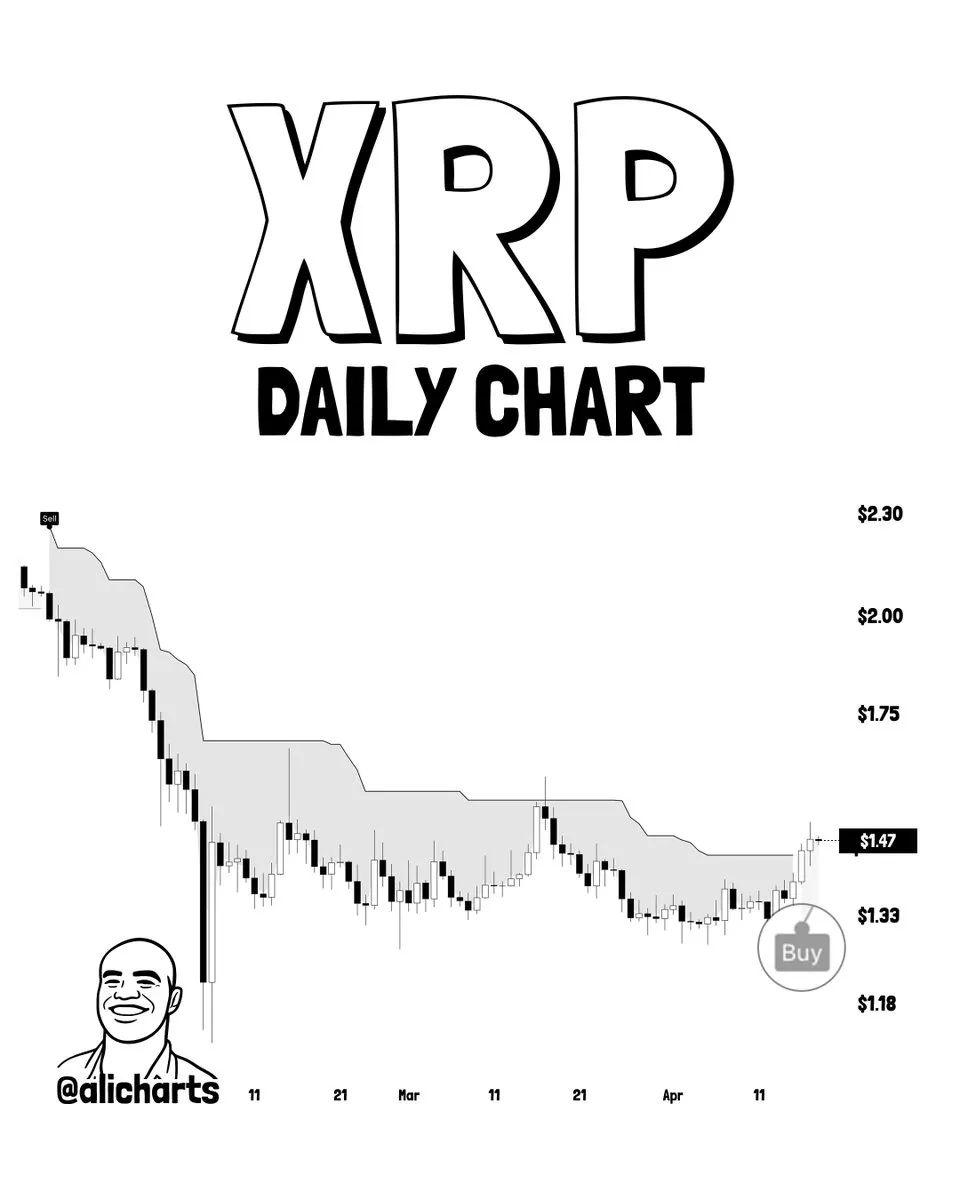
Ali’s first signal is a change in the macro trend on the daily chart. In the hilo , he said the SuperTrend indicator has now issued its first buy signal since January, a notable reversal after months of persistent sell pressure. He wrote: “On the daily chart, the SuperTrend indicator has flashed a buy signal for the first time since January. This flip suggests that selling pressure is waning down, and XRP could be gearing up for a trend reversal.”
That call builds on an earlier April 18 post in which Ali framed the signal as a potentially important inflection point. “For the first time since Jan. 17, the SuperTrend indicator has flipped bullish on the daily chart. After months of ‘sell’ pressure, we are officially seeing a buy signal that anticipates a major comeback in XRP’s trend. While the trend has shifted, the real test lies at $1.55,” he wrote.
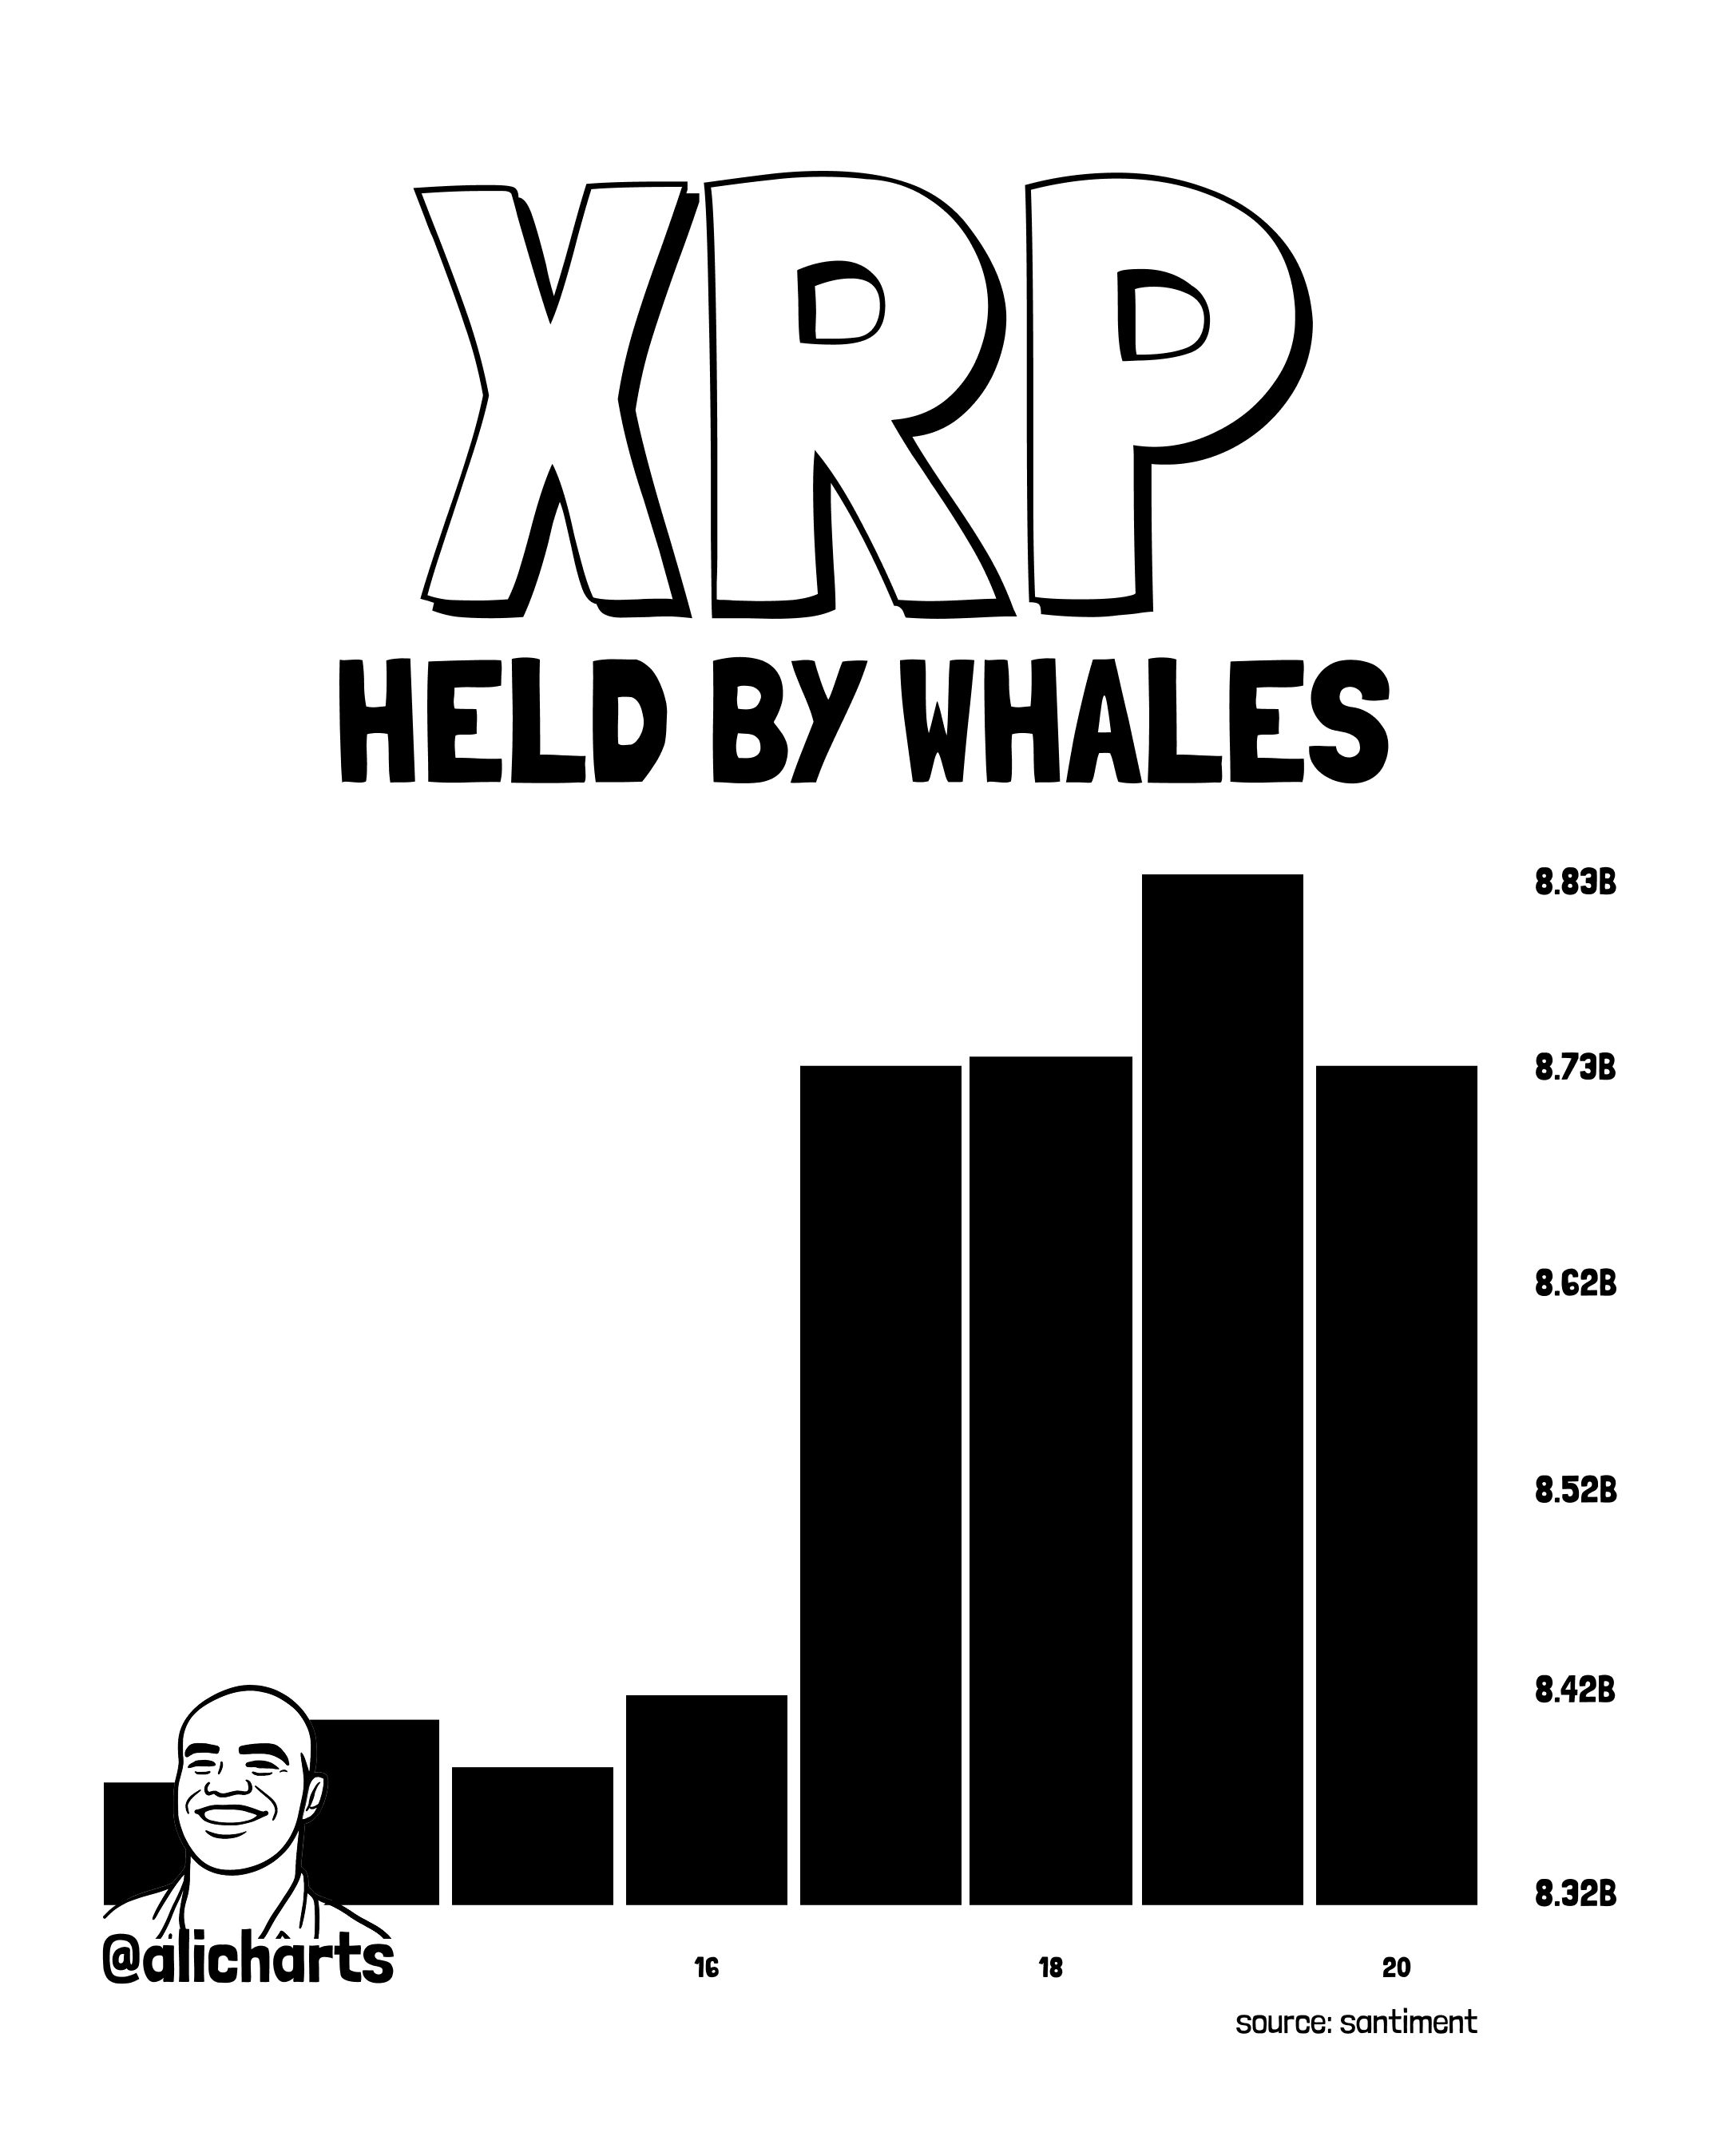
The second sign is positioning from large holders. Ali said on-chain data from Santiment shows whales accumulated roughly 360 million XRP over the past week. If that accumulation continues, it adds weight to the idea that the recent change in trend is being supported by capital rather than by a short-lived bounce.
The third sign is the setup forming on lower time frames. Ali said XRP has been compressing into a symmetrical triangle, a structure he argued could foreshadow a 35% move once price breaks out decisively. In his telling , the pattern fits with the broader shift underway: macro conditions are improving, supply is being pulled off exchanges, and price is coiling into a tighter range.
“As the macro trend flips and supply is pulled off exchanges, a symmetrical triangle has formed on the lower time frames. This pattern has compressed the price into a tight range, anticipating a 35% move once a breakout occurs,” he writes.
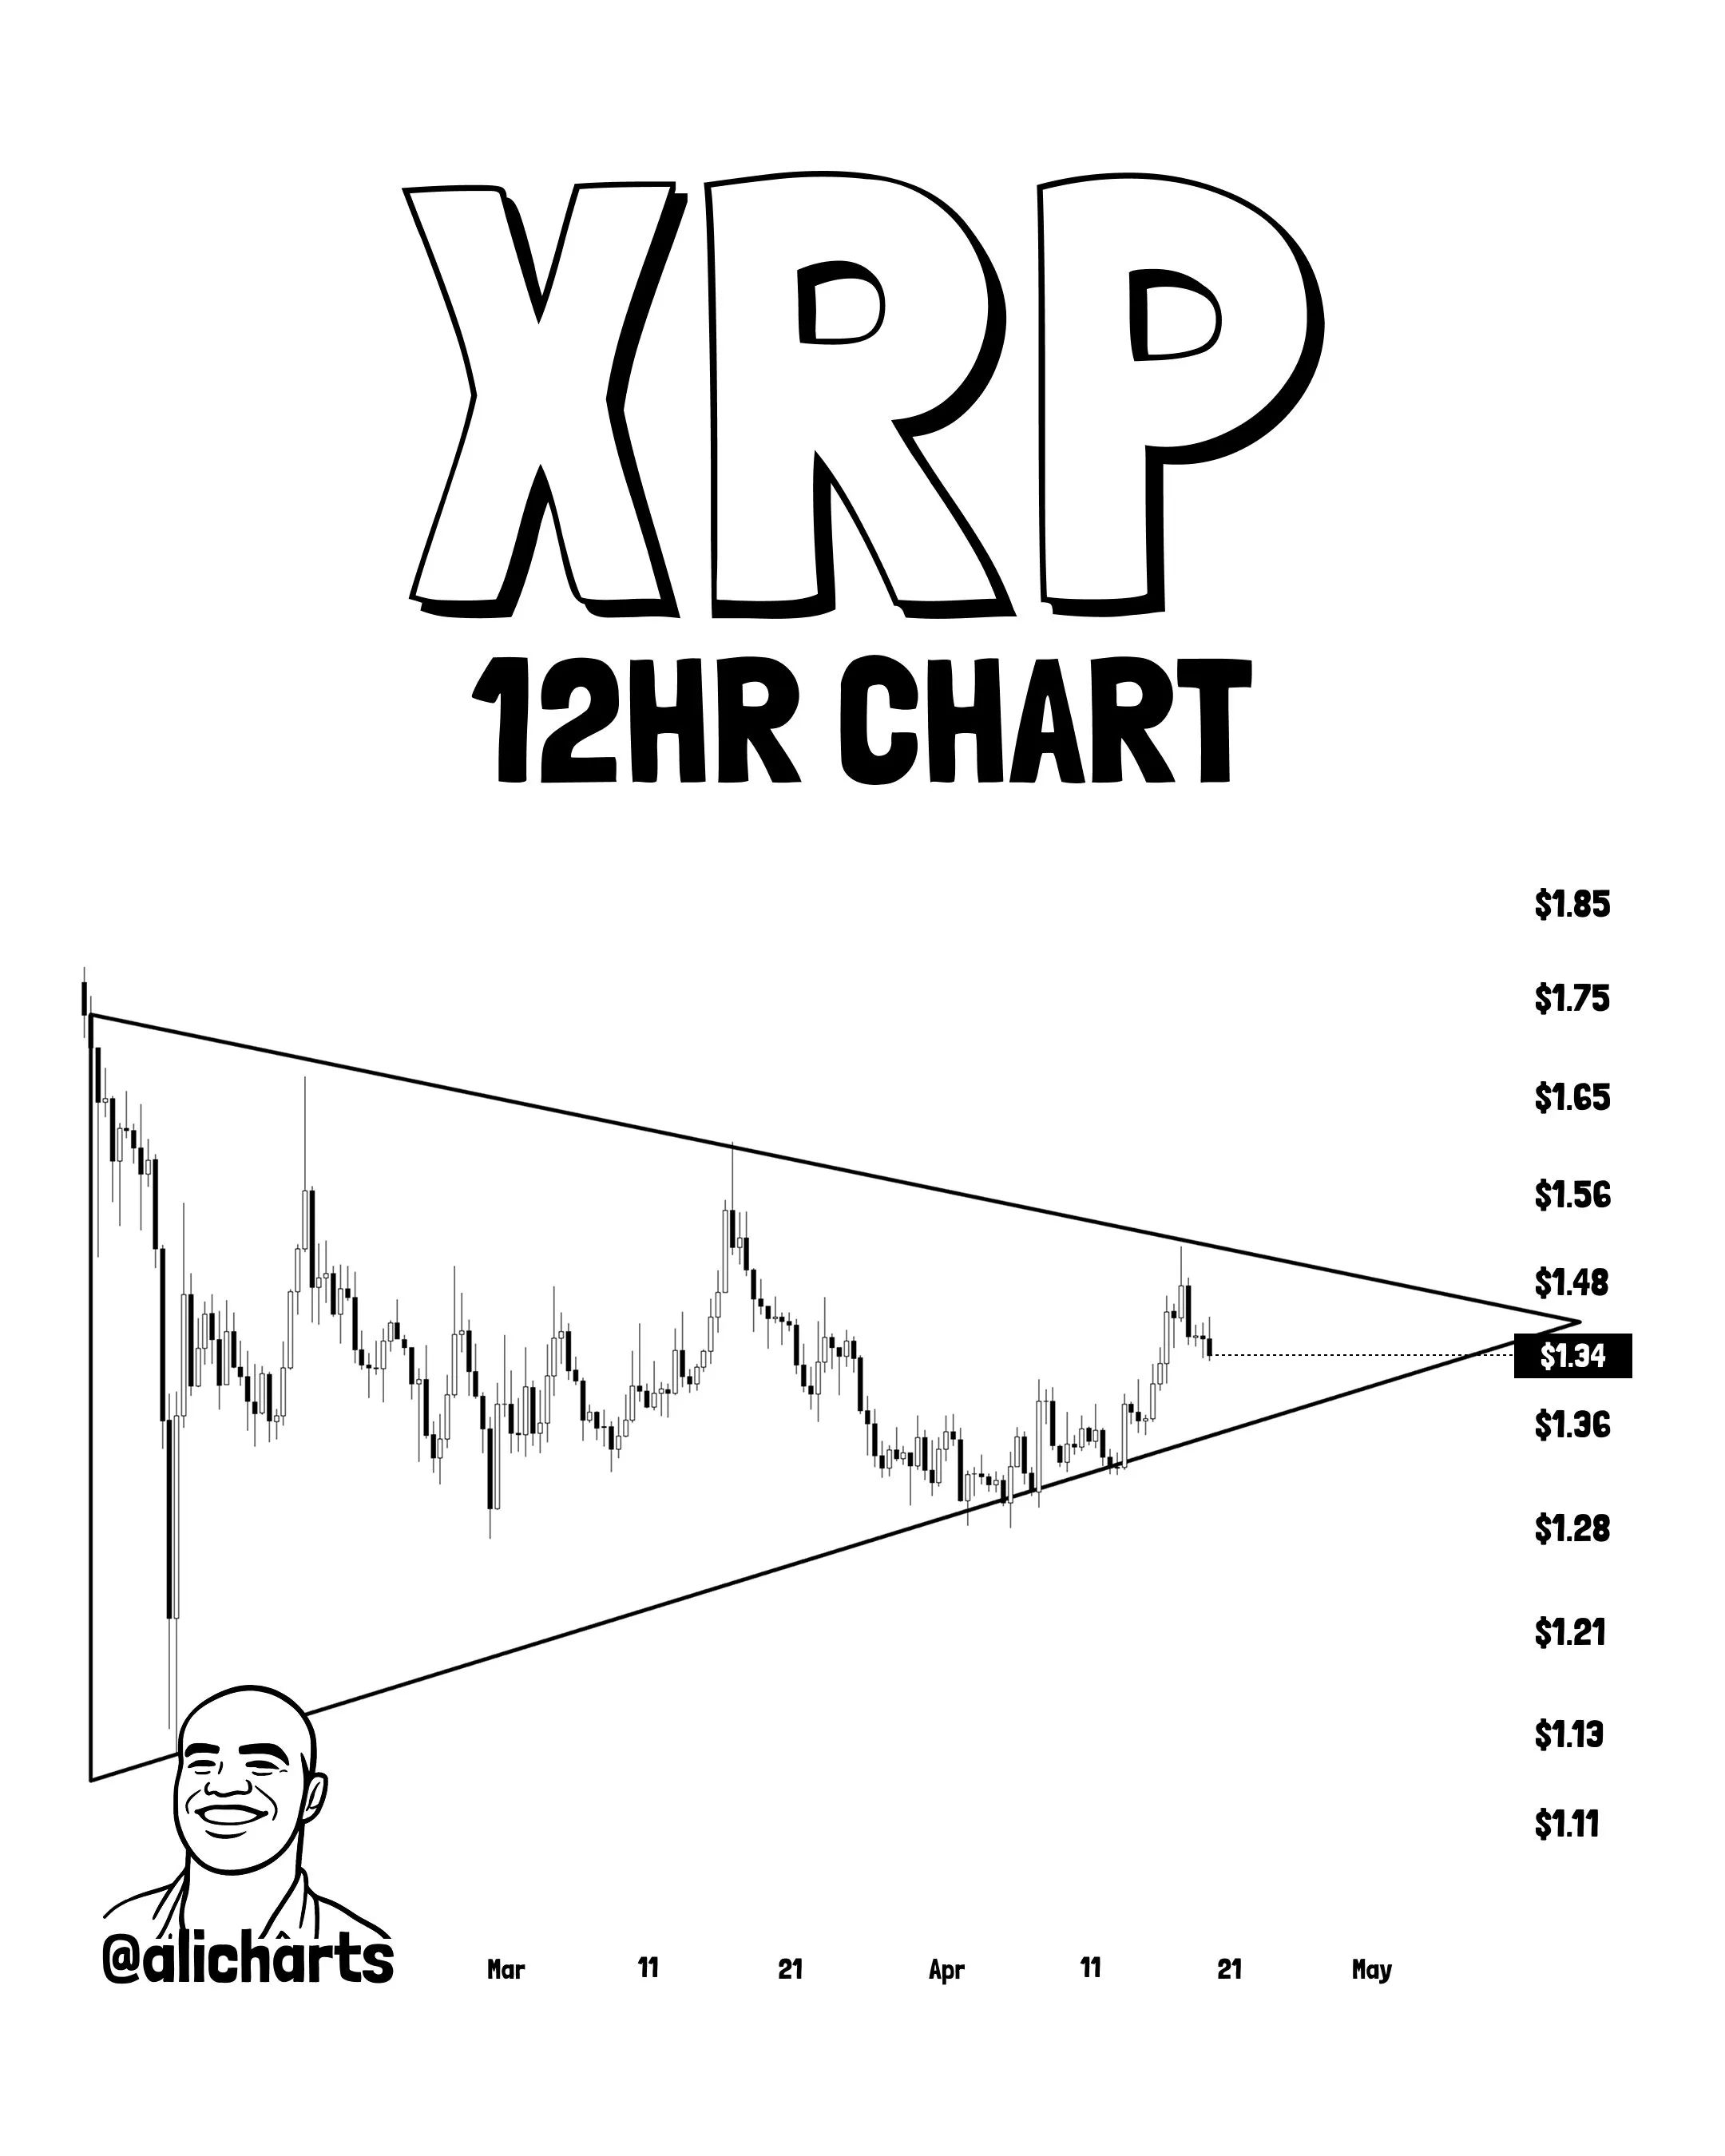
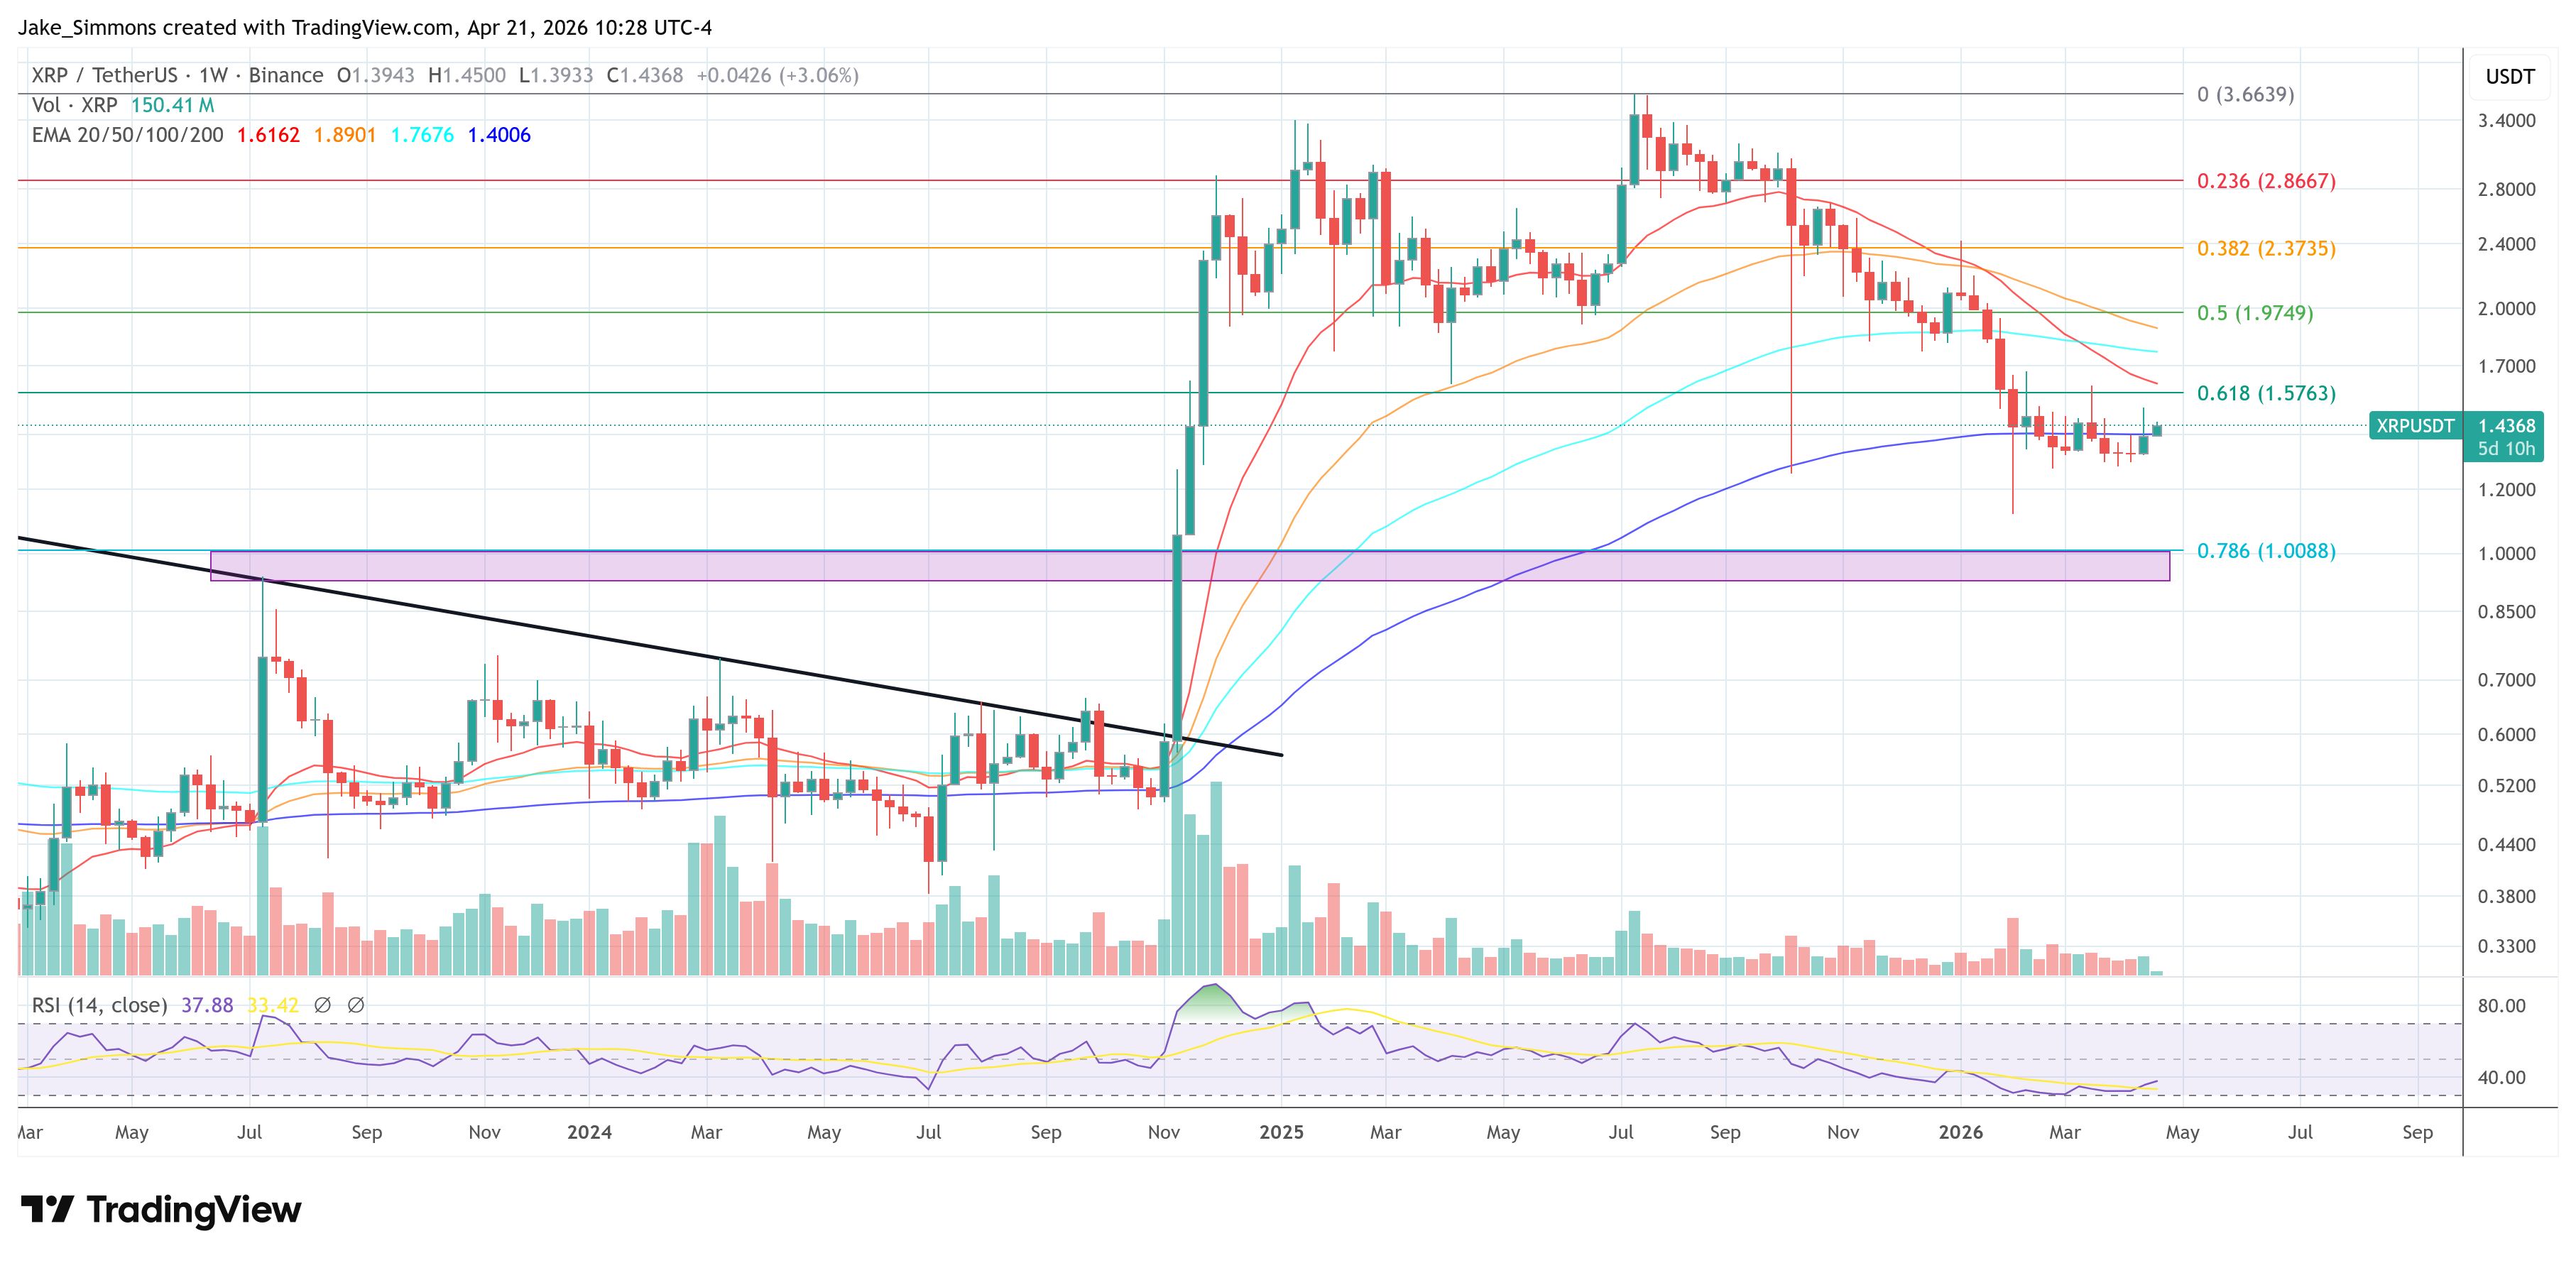
The fourth sign is the clarity of the invalidation and breakout levels. He says a daily close above $1.55 would validate the breakout and open the way toward $1.90, describing that resistance as “the key level” that has capped upside recently. At the same time, he said the bullish outlook remains intact only as long as XRP holds the $1.30 support zone.
Rather than calling for an immediate breakout, Ali is outlining a market that may be transitioning from defense to offense, with defined levels that would either confirm or weaken the thesis. A bullish SuperTrend flip, whale accumulation, a compressed triangle, and a nearby resistance test do not amount to proof on their own. Together, though, they form a coherent case that XRP may be moving out of a bearish regime and into an early bullish one.
At press time, XRP traded at $1.4368.