
Related tickers
| # | Name | Price | 24h % | 7d % | 1M % | 1Y % | Last 7 Days | |
|---|---|---|---|---|---|---|---|---|
| 1 | LTCUSD Litecoin vs US Dollar | 56.54 USD | -3.02% | -1.21% | -20.20% | -42.84% | ||
| 2 | ETHUSD Ethereum vs US Dollar | 2340.98 USD | -1.82% | -1.23% | -12.81% | -42.61% | ||
| 3 | MBTUSD milliBitcoin vs US Dollar | 80.343 USD | -1.08% | -1.22% | -4.83% | -29.27% | ||
| 4 | ETCUSD Ethereum Classic vs US Dollar | 7.458 USD | -2.42% | -1.05% | -21.37% | -54.75% |
Frequently asked questions about Bitcoin vs US Dollar
What is the Bitcoin vs US Dollar price today?
The current price of Bitcoin vs US Dollar (BTCUSD) is 80432.50. Over the past 24 hours, it has changed by -1.09%. You can follow the latest movement on the BTCUSD price chart and compare it with other crypto gainers and losers.
What does BTCUSD represent?
BTCUSD shows the value of one cryptocurrency relative to another asset or currency. The first asset is the base asset, while the second is the quote asset. The current price indicates how much of the quote asset is needed to buy one unit of the base asset.
What is the 24-hour trading volume of Bitcoin vs US Dollar?
The 24-hour trading volume of Bitcoin vs US Dollar (BTCUSD) is 264.66 K. Higher volume usually means stronger market activity and better liquidity for traders.
How has the Bitcoin vs US Dollar price changed over time?
Bitcoin vs US Dollar has changed by -0.92% over the last week and by -4.82% over the last month. Use the BTCUSD chart to review longer-term price dynamics and recent market behavior as of 2026.10.26.
Where can I buy Bitcoin vs US Dollar?
Bitcoin vs US Dollar (BTCUSD) can usually be bought through cryptocurrency exchanges and brokers. Before trading, compare fees, liquidity, available payment methods, and account requirements.
Should I buy Bitcoin vs US Dollar?
Whether Bitcoin vs US Dollar is suitable for you depends on your goals, risk tolerance, and market view. Crypto assets can be highly volatile, so review the BTCUSD chart, recent news, liquidity, and technical signals before making a decision.
How has Bitcoin vs US Dollar performed this year?
Since the beginning of the year, Bitcoin vs US Dollar (BTCUSD) has changed by -8.35%. Combine long-term performance with the BTCUSD chart, market news, and technical analysis before making trading decisions.
What do traders think about Bitcoin vs US Dollar?
Traders can discuss Bitcoin vs US Dollar (BTCUSD), share market ideas, and follow community sentiment on metatrader.com. Community opinions can be useful, but they should be combined with your own analysis.
News
Bitcoin and Gold Hit a Historic First in 2026. The Two “Safe Havens” Are Now the Worst Assets
BTC Falls Below $80,000, Down 0.80% Intraday
$109M in Futures Liquidations Across Crypto Market in Past 24 Hours, Longs and Shorts Both Hit
Bitcoin Price Today: Weak Bounce Puts $75K In Play If $80K Breaks
Bitcoin (BTC) Price Prediction: $74K Liquidity Gap Puts $80K Support to the Test
Strive CEO Matt Cole Posts Another Chart, Possibly Hinting at BTC Accumulation Data Next Week
Mysterious Entity Has Bought a Cumulative 3,000.5 ETH Recently, Worth About $7.06 Million
Bitcoin ETFs Snap Two-Week Losing Streak Despite Late-Week Slide
3 Stocks to Watch This Week as Earnings Season Hits Crypto
Anthony Pompliano: Bullish on BTC, Gold and AI, With Prediction Markets and Compute Markets Worth Watching
Galaxy Research Decodes Three Weeks of Bitcoin "Garbled Inscriptions": Don't Over-Interpret Hidden Messages — Likely a Script Test
Charts & Ideas
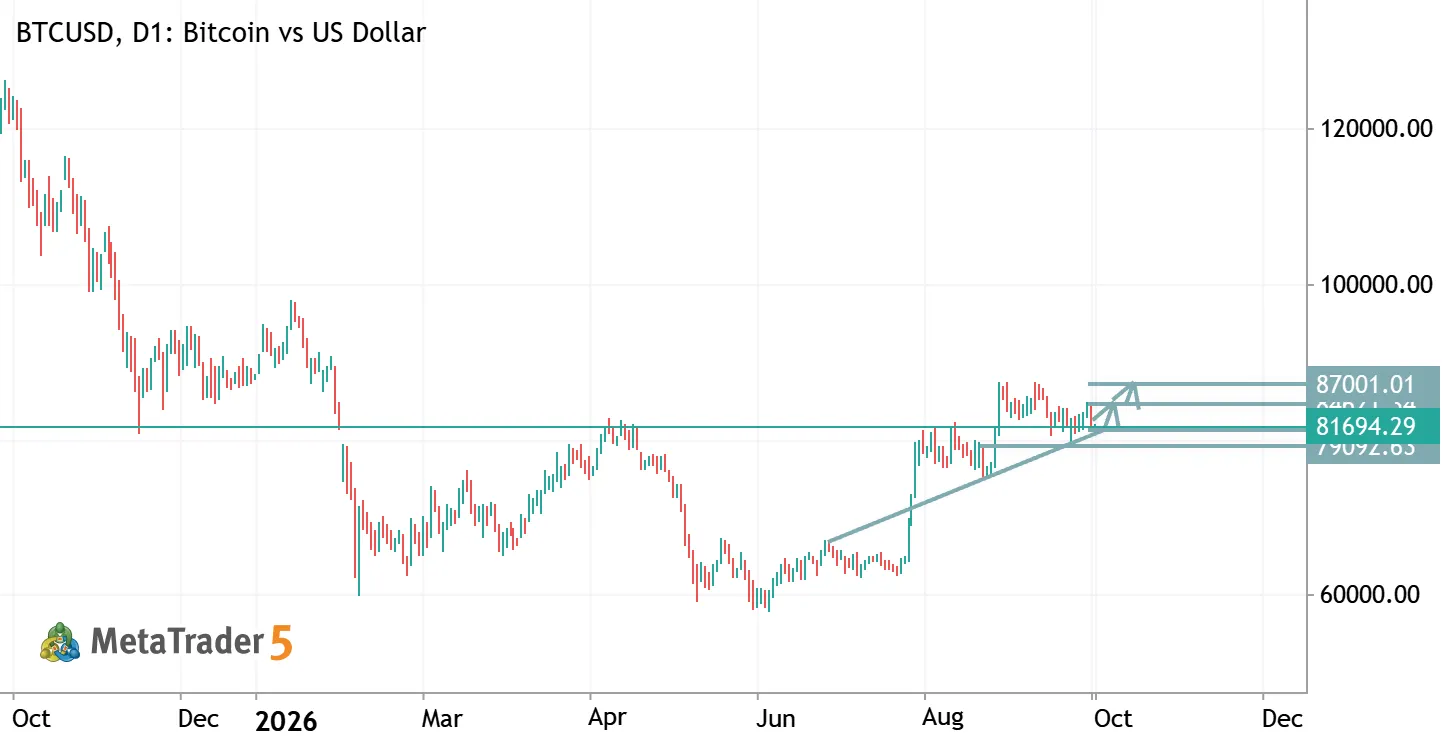
BTCUSD TRADE IDEA
BTCUSD – Trade Analysis (D1) Trend: Bullish recovery; price is consolidating above rising trendline support. Buy Entry: 81,700–82,000 (after bullish confirmation) TP1: 84,621 TP2: 87,001 Support: 79,092 Stop Loss: Below 79,000. Outlook: Bullish above 81,700. A breakout above 84,621 may push BTC toward 87,001. Risk management: Wait for confirmation and risk only a small portion of your capital

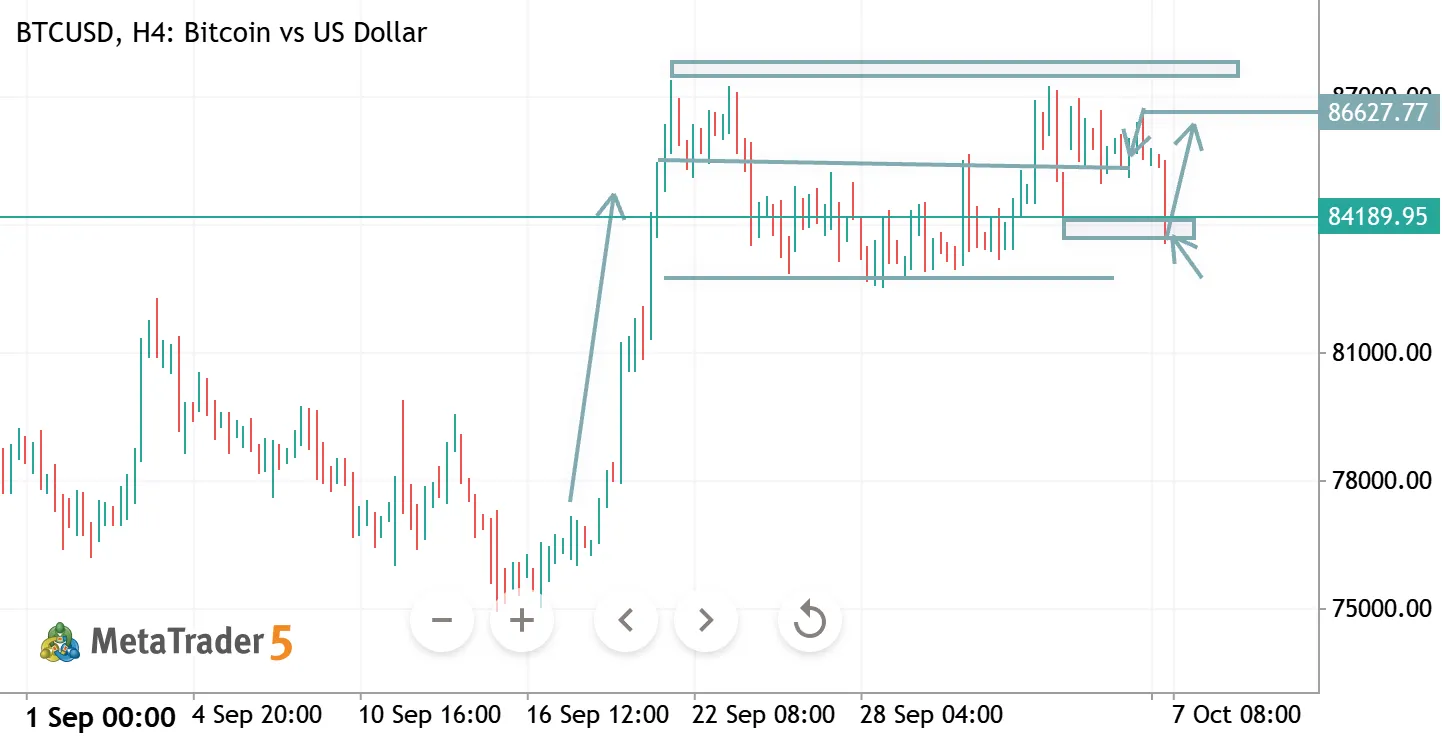
BTCUSD H4 ANALYSIS
BTCUSD H4 Analysis
BTC is consolidating near 84,100 after a strong recovery. The 84,000–84,500 zone is key support; holding above it could push price back toward 86,700–88,000.
🔹 Support: 84,000–84,500 🔹 Resistance: 86,700–88,000 🔹 Bias: Bullish above 84,000 🔹 Key Trigger: Break above 86,700 → upside continuation.

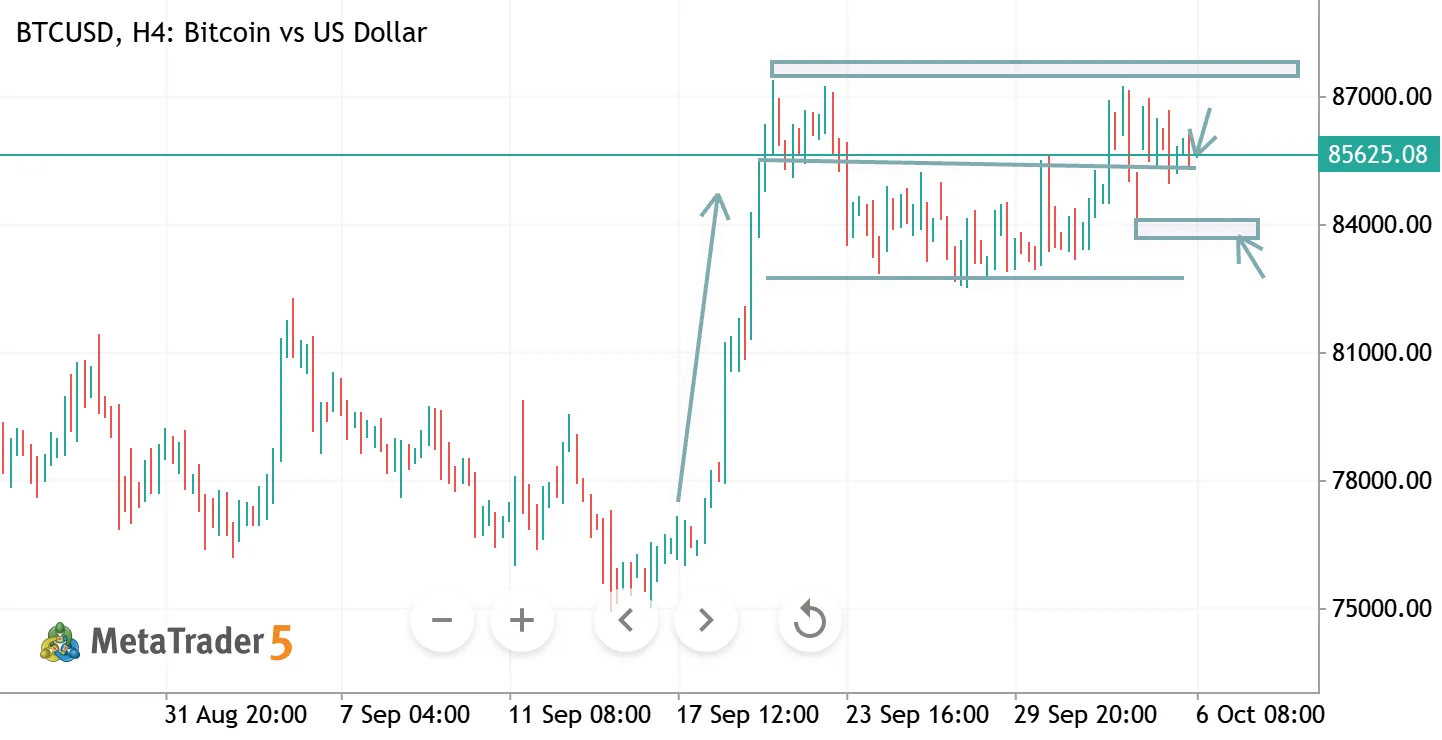
BTCUSD H4 ANALYSIS
BTCUSD H4 Analysis
BTC is consolidating below the 86,000–87,000 resistance zone after a strong recovery. A breakout above this area could resume the bullish move toward 88,000, while rejection may pull price back toward 84,000–82,500.
🔹 Resistance: 86,000–87,000 🔹 Support: 84,000–82,500 🔹 Bias: Bullish above 84,000 🔹 Key Trigger: H4 close above 87,000 → upside continuation.
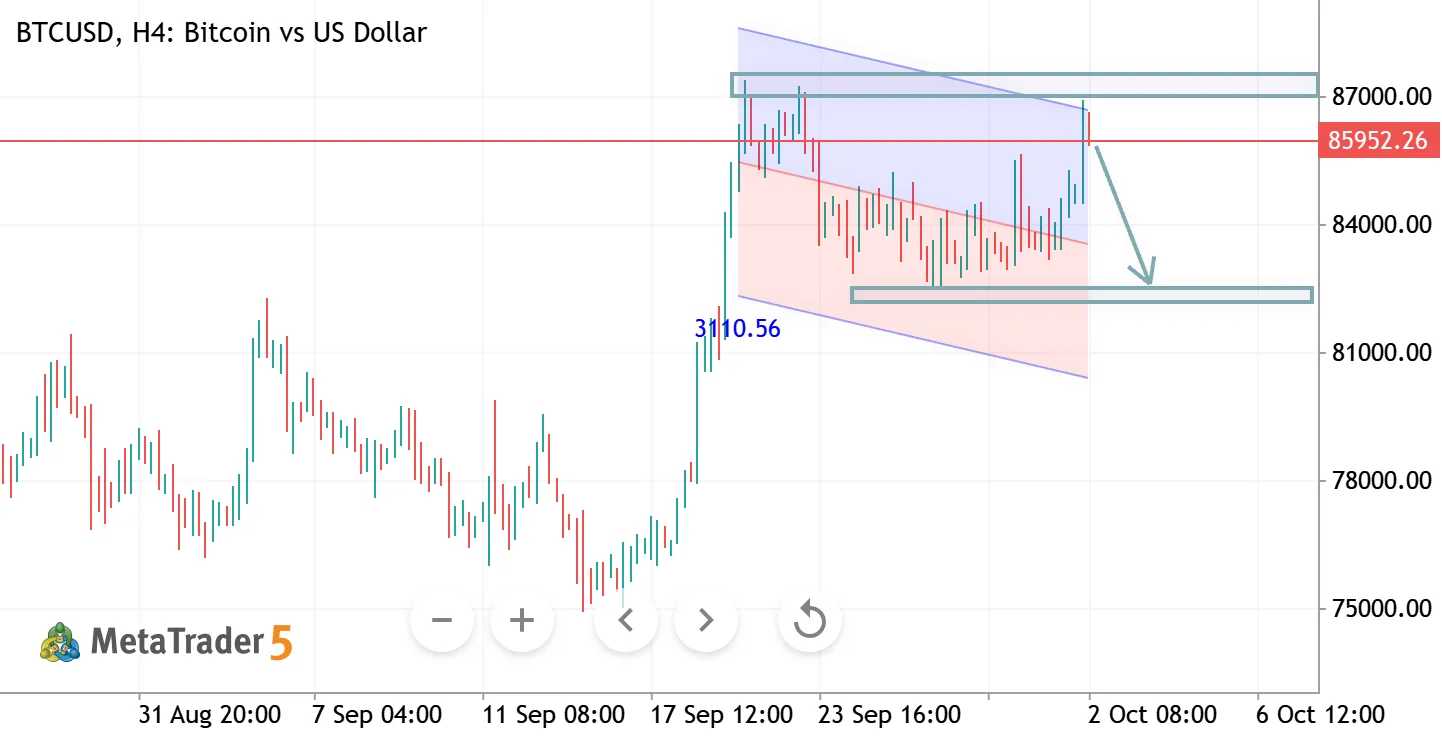
BTCUSD H4 ANALYSIS
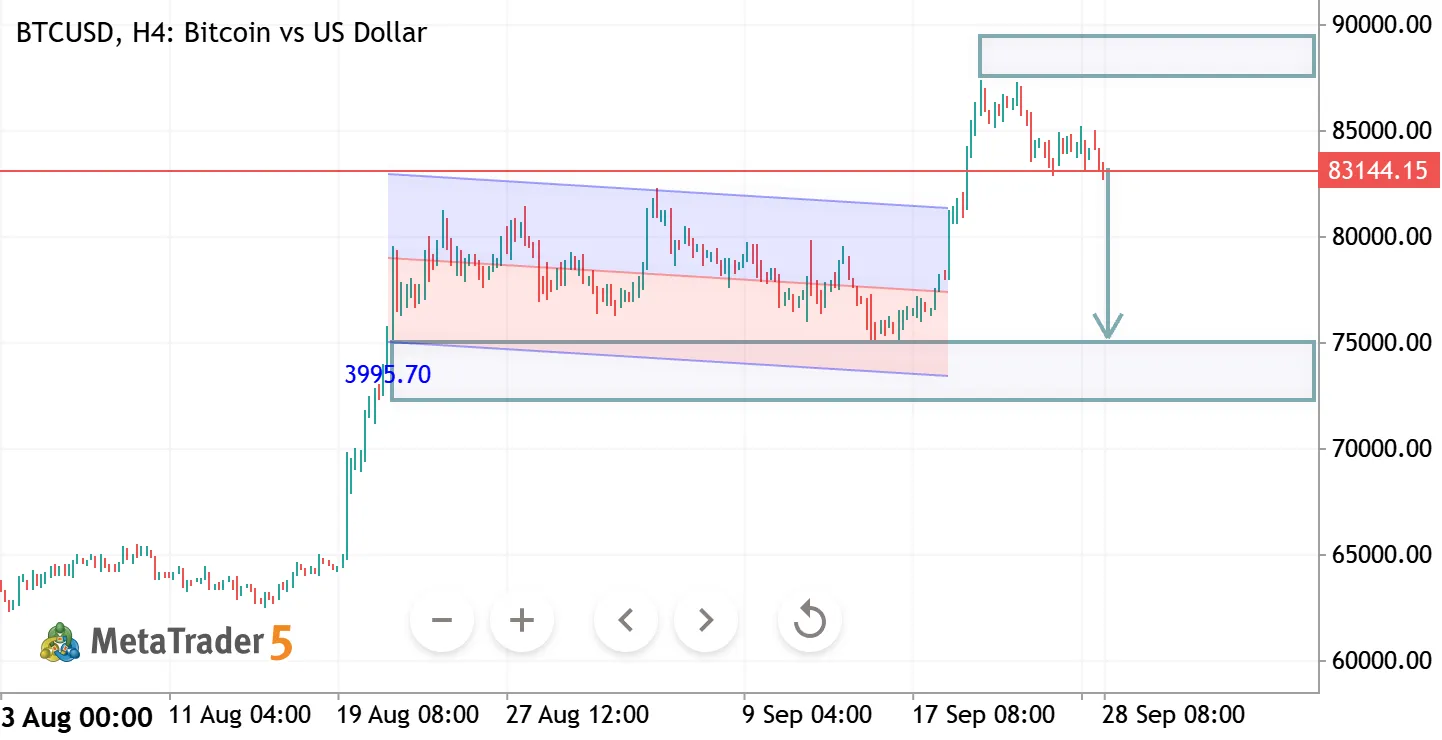
BTCUSD H4 Analysis Bitcoin is testing a major resistance zone around 85,800–86,500 after a strong recovery. Rejection here could trigger a pullback toward the 82,000 support zone. 🔹 Resistance: 85,800–86,500 🔹 Support: 82,000–82,500 🔹 Bias: Bearish below 86,500 🔹 Key Trigger: Break above 86,500 → bullish continuation; rejection → downside toward 82,000.
BTCUSD H4 ANALYSIS
GBPUSD – Technical Analysis 📊
GBPUSD is showing signs of a potential bullish reversal after moving within a descending channel. Price is holding around 1.3230, with the chart indicating a possible move toward the 1.3380–1.3400 resistance zone.
🔹 Support: 1.3200–1.3230 🔹 Target Zone: 1.3380–1.3400 🔹 Key Level: Sustained strength above 1.3260 would support the bullish setup.
Disclaimer: Technical analysis is based on chart structure and is not financial advice.
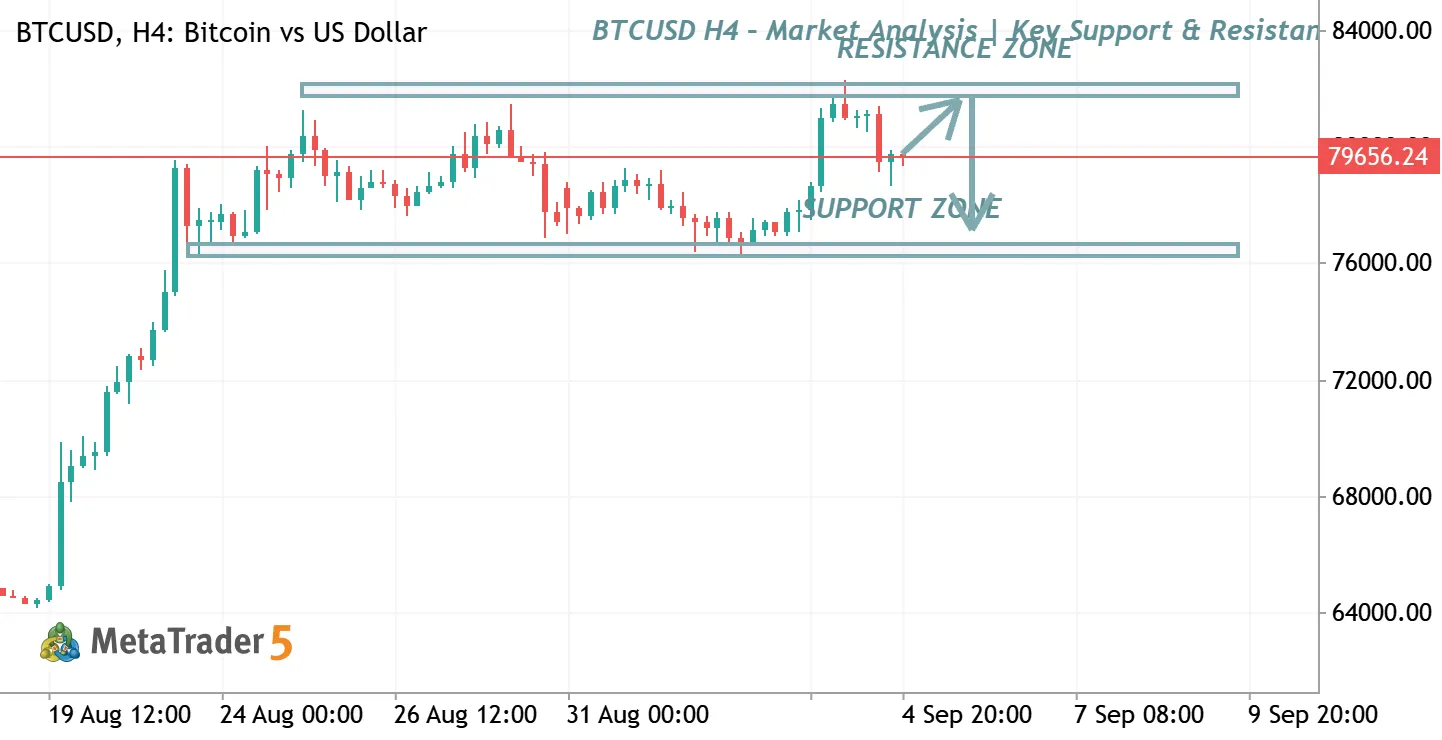
BTCUSD H4 – Market Analysis | Key Support & Resistance
BTCUSD is currently trading between important support and resistance zones on the H4 timeframe. Price is approaching a critical area where traders should watch for confirmation of either a bullish breakout toward the resistance zone or a bearish rejection toward support . 📈 Bullish Scenario: Break and hold above resistance may open the way for further upside.
📉 Bearish Scenario: Rejection from resistance could lead price back toward the major support zone. ⚠️ Trade with proper risk management and wait for confirmation before entering


The BTCUSD doesn’t have other trading ideas at this time
Browse ready-made trading ideas or select a symbol and create your own
Go to Charts and Trading Ideas