Recent ZEC price action has produced conflicting signals. Some analysts point to signs of seller exhaustion and improving long-term momentum, while liquidity maps and trend-following indicators suggest the cryptocurrency could experience another period of heightened volatility before establishing a clearer direction.
The combination of a well-defined support zone, concentrated liquidity, and mixed technical readings has placed ZEC price prediction discussions at the center of attention as market participants monitor whether buyers can maintain control.
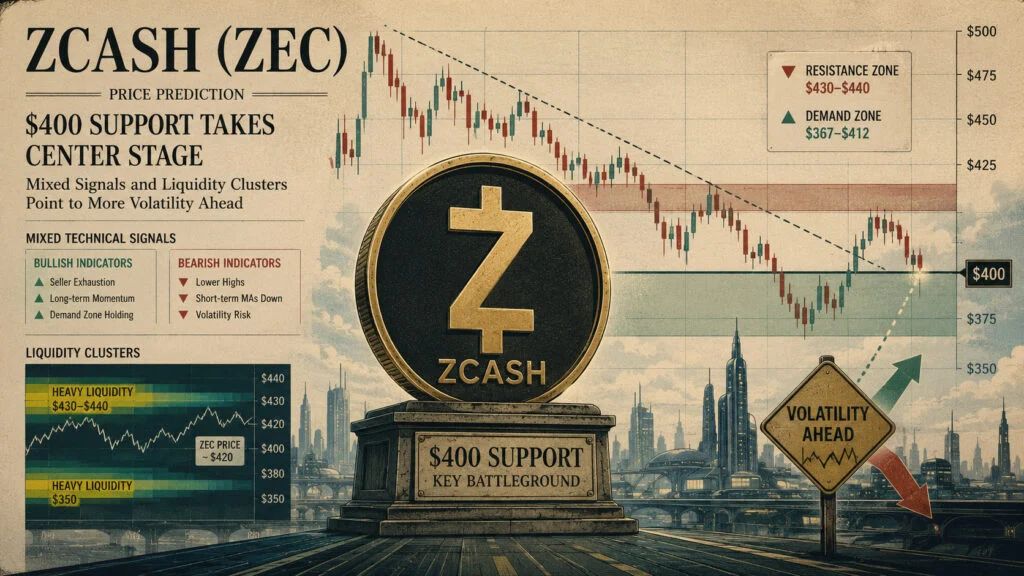
$400 Support Emerges as a Key Battleground for ZEC Price
Recent chart analysis shows Zcash rebounding after briefly testing the $400 psychological support level, where price formed a notable wick rejection on the four-hour chart. The move interrupted a sustained decline and suggested that selling pressure weakened as buyers stepped in around the round-number support.
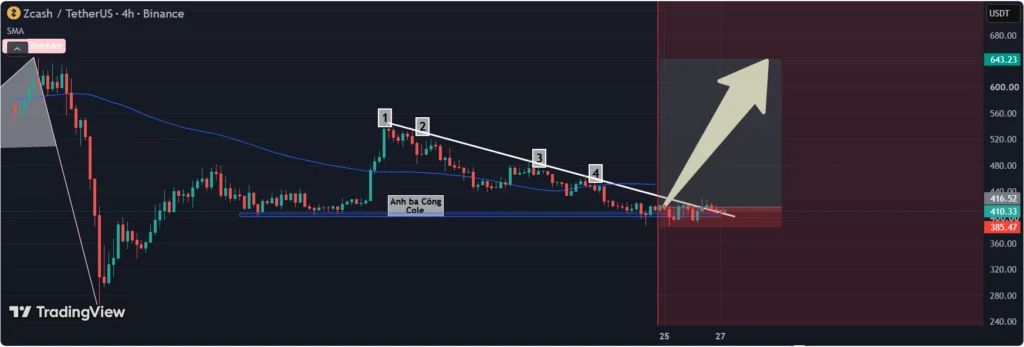
ZEC rebounded sharply after rejecting the key $400 psychological support, signaling that selling pressure may be easing. Source: AnhbaCong_ on TradingView
TradingView analyst AnhbaCong_ noted that the preceding descending channel had already recorded four separate tests of its upper trendline, a pattern that often signals a market nearing the end of an established trend. Although this alone does not confirm a reversal, repeated trendline interactions combined with a strong rejection from support indicate that bearish momentum may be losing strength.
The recovery also comes after ZEC retreated from higher levels earlier in the month, placing renewed attention on whether the current support can serve as the foundation for another attempt toward overhead resistance.
Liquidity Heatmap Suggests Volatility May Increase
Beyond traditional chart patterns, derivatives market data points to another reason traders remain cautious.
Market analyst @Alaouicapital highlighted Binance perpetual futures liquidity data showing dense liquidity clusters between $430 and $440, while another significant concentration sits near $350. With ZEC recently trading around $420, these zones may become magnets for price action as leveraged positions build on both sides of the market.
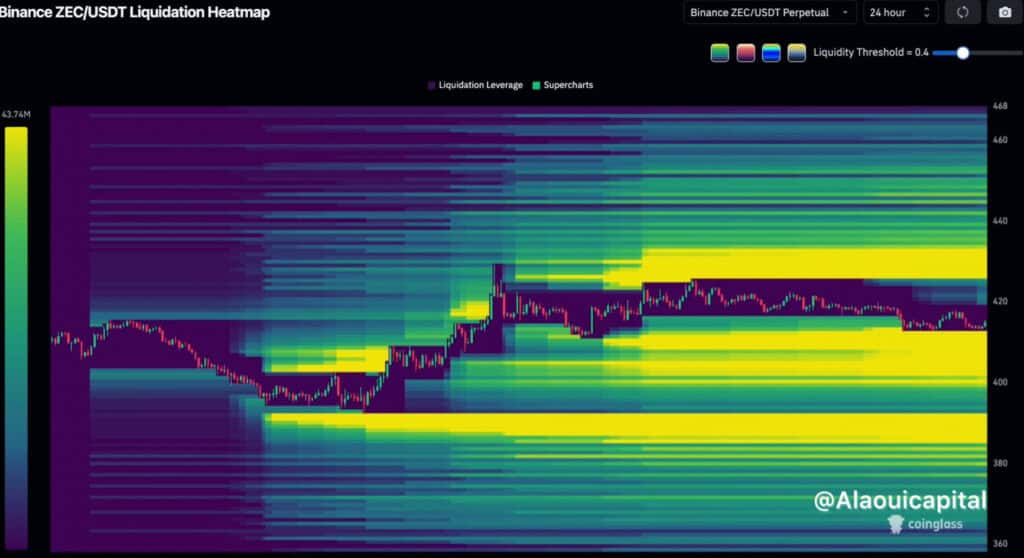
ZEC is trading between major liquidity clusters at $430-$440 and $350, with analysts suggesting that sustained buying near current levels could draw the price toward the upper liquidity zone. Source: @Alaouicapital via X
The accompanying 24-hour liquidity heatmap displayed concentrated liquidity bands across the $380-$435 range alongside elevated leverage positioning. Such conditions can create sharp moves as stop-loss orders and leveraged positions are triggered, increasing the likelihood of rapid price swings in either direction rather than guaranteeing a specific trend.
Demand Zone Continues to Hold After Resistance Rejection
Another market assessment from SpearTrades places ZEC within a broader $367-$412 demand zone following its rejection near $445.
The analysis assigned the current setup a 7.2/10 technical rating, suggesting the overall market structure remains constructive as long as buyers defend the existing demand area. Holding this zone could allow ZEC to revisit higher resistance levels, while losing it would weaken the current structure.
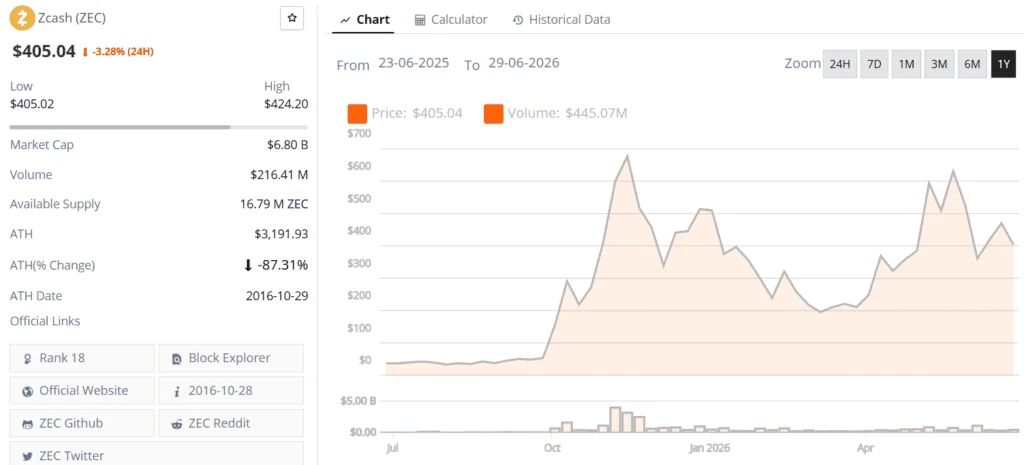
Zcash (ZEC) price chart. Source: Brave New Coin
The analyst also emphasized that broader crypto market conditions remain an important variable. If Bitcoin extends its weakness, downside pressure could increase across altcoins, with $300 remaining an important historical support level for ZEC.
The observation reinforces that Zcash continues to trade with meaningful correlation to the wider digital asset market despite its unique privacy-focused ecosystem.
Mixed Technical Indicators Keep ZEC Price Prediction Balanced
Broader technical indicators present a more measured picture.
According to TradingView technical data , ZEC is trading around $410-$420, with the overall summary rating remaining neutral. Oscillators, including the Relative Strength Index (RSI 14), MACD, Stochastic %K, Commodity Channel Index (CCI 20), and Williams %R, also register broadly neutral readings, indicating that momentum is neither excessively bullish nor bearish.
However, moving averages continue to lean more cautiously. Short-term 10-, 20-, and 30-period EMA/SMA indicators remain positioned in bearish alignment, acting as overhead resistance. In contrast, longer-term signals appear more constructive, with the one-week and one-month technical summaries shifting toward buy ratings, suggesting an improving longer-term market structure if current support levels remain intact.
This divergence between shorter and longer timeframes reflects a market still searching for confirmation before establishing its next sustained trend.
Key Levels to Watch
From a technical perspective, $400 remains the primary psychological support level, followed by the $380-$390 region if additional downside develops.
On the upside, traders continue monitoring resistance between $420 and $430, while a successful breakout above $430-$445 could improve the broader technical outlook and potentially open the path toward higher price targets.
For now, expanding trading volume would provide stronger confirmation of bullish momentum, whereas repeated failures below short-term moving averages may keep ZEC trading within its current consolidation range.
With liquidity concentrated on both sides of the market and technical indicators offering mixed signals, the ZEC price appears positioned for another period of elevated volatility as traders watch whether the critical $400 support level continues to attract buyers.