


The XRP price was recently trading around $1.10–$1.14, with technical signals presenting a mixed picture. While some momentum indicators remain neutral and the MACD offers a bullish signal, a cluster of moving averages above the current price continues to point to resistance.
The latest setup follows multiple failed attempts to move higher. According to technical analysis shared by ChartNerdTA, XRP has now faced a third rejection from the daily 50 EMA near $1.16 within roughly two months. A pullback toward ascending trendline support has followed each rejection.
At the same time, CryptoAlchemX has identified the $1.10–$1.15 region as a critical support zone on the 12-hour chart. The analyst noted that a break below this area on lower timeframes could expose XRP to fresh lower lows, although the broader daily structure could still leave room for a recovery if buyers step in.
The contrasting signals have made the XRP price prediction increasingly dependent on whether bulls can defend the current support structure or whether another rejection triggers a broader correction.
XRP Price Today Faces Key $1.10–$1.15 Support
The latest technical setup places the XRP current price near a significant decision point.
CryptoAlchemX highlighted the $1.10–$1.15 zone as an important area for XRP on the 12-hour chart, with a descending trendline positioned above the market. Holding this region could allow buyers to stabilize the price and attempt another recovery.
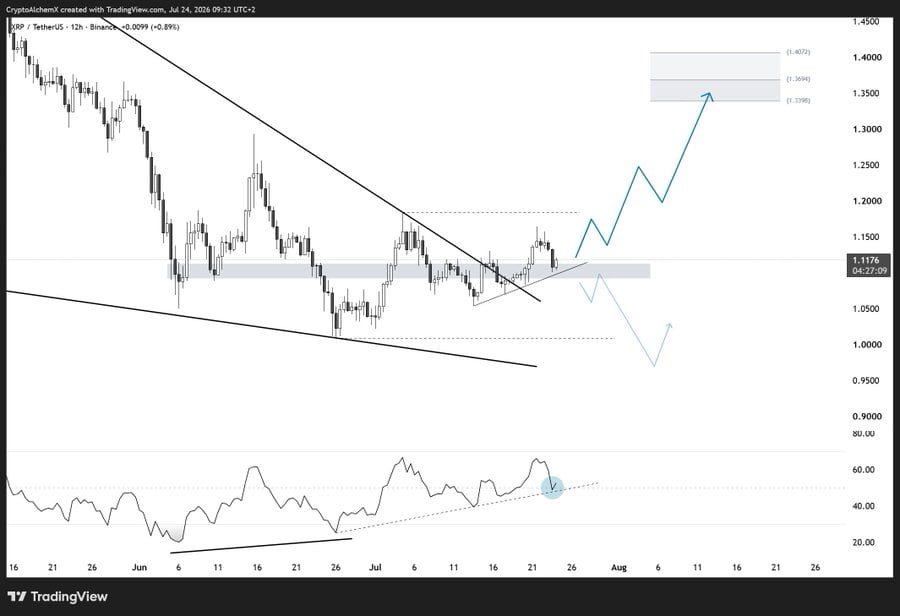
CryptoAlchemX identifies the $1.10–$1.15 zone as critical support for XRP, with a descending trendline adding overhead resistance. Source: @CryptoAlchemX via X
However, a decisive breakdown below the support area could weaken the short-term structure. The analyst suggested that such a move may increase the risk of new lower lows as sellers gain greater control.
From a higher-timeframe perspective, CryptoAlchemX presented a more constructive possibility. The current weakness could represent a final capitulation phase before buyers attempt to establish a stronger base. If that scenario develops, the analyst sees potential for a larger advance toward the $1.35 area.
That outlook remains conditional, however. XRP would first need to demonstrate that the current support zone can withstand further selling pressure.
Third Rejection From Daily 50 EMA Raises XRP Price Prediction Concerns
The latest pullback comes after XRP again failed to overcome the daily 50 EMA near $1.16.
ChartNerdTA's analysis identified the latest rejection as the third instance in approximately two months in which XRP was turned away from the same technical region. The chart also highlighted a broader resistance block around $1.24, which has remained a significant barrier for the bulls.
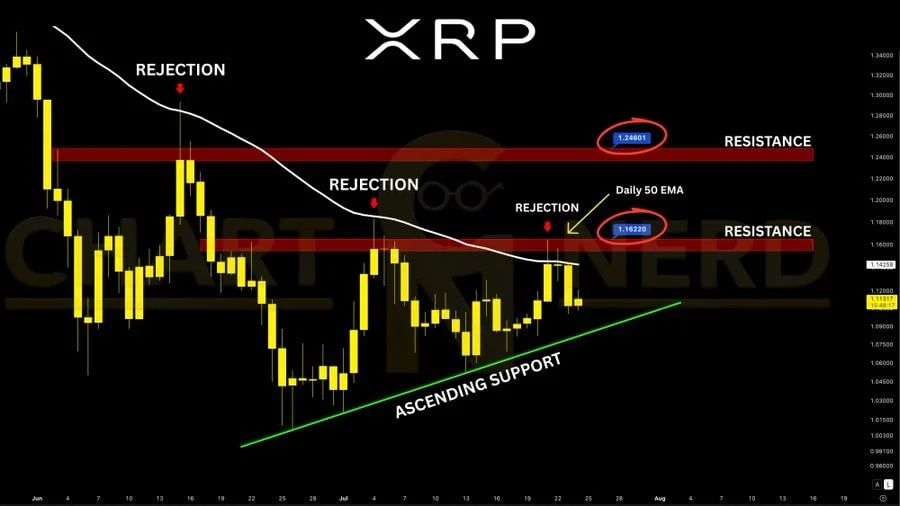
XRP has faced a third rejection from the daily 50 EMA near $1.16 and the $1.24 resistance zone within two months, followed by a pullback toward ascending support. Source: @ChartNerdTA via X
XRP's recent price action has therefore created a sequence of failed upside attempts. Each rejection has pushed the price back toward an ascending support trendline, making that trendline increasingly important for the next stage of the market.
At the time of the analysis, XRP was hovering around $1.13–$1.14 while testing this ascending support. A successful defense could allow the cryptocurrency to challenge the $1.16 area again before potentially moving toward $1.24.
Conversely, losing the trendline would weaken the bullish structure. Previous analysis cited by ChartNerdTA points to the $1.00 double-bottom region as a potential downside target, with deeper levels around $0.70–$0.90 becoming relevant if broader selling accelerates.
Stochastic RSI Signals Caution for XRP Price Forecast
Momentum indicators are also providing an important warning for the current XRP price forecast.
ChartNerdTA pointed to the daily Stochastic RSI after XRP reached approximately $1.16, noting that previous overbought readings had coincided with local market tops.
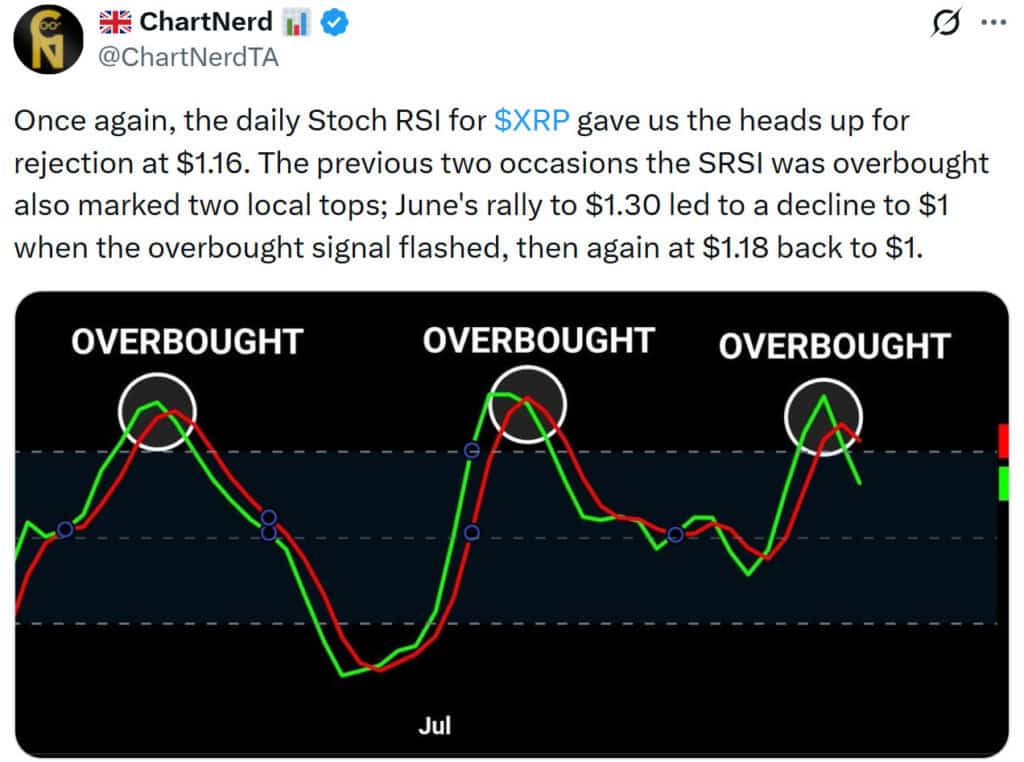
Daily Stochastic RSI analysis shows XRP's latest overbought reading near $1.16, a signal that has previously coincided with local market tops. Source: @ChartNerdTA via X
Historical examples referenced in the analysis include a rally toward $1.30 in June, followed by a decline toward $1.00. Another move toward approximately $1.18 was also followed by a retreat to the $1 level after the Stochastic RSI reached an overbought reading.
The latest signal does not guarantee that XRP will repeat those moves. However, the pattern highlights the risk of another rejection if buyers fail to generate sufficient momentum above resistance.
With XRP again trading close to the levels associated with previous reversals, traders are watching whether momentum can strengthen without another overbought signal triggering renewed selling.
XRP Technical Analysis Shows Mixed Momentum
The broader XRP technical picture remains divided between neutral momentum readings and bearish moving-average signals.
Based on the provided TradingView data from the Bitstamp XRP/USD market, XRP was recently trading near $1.10078, down approximately 3.56% during the session.
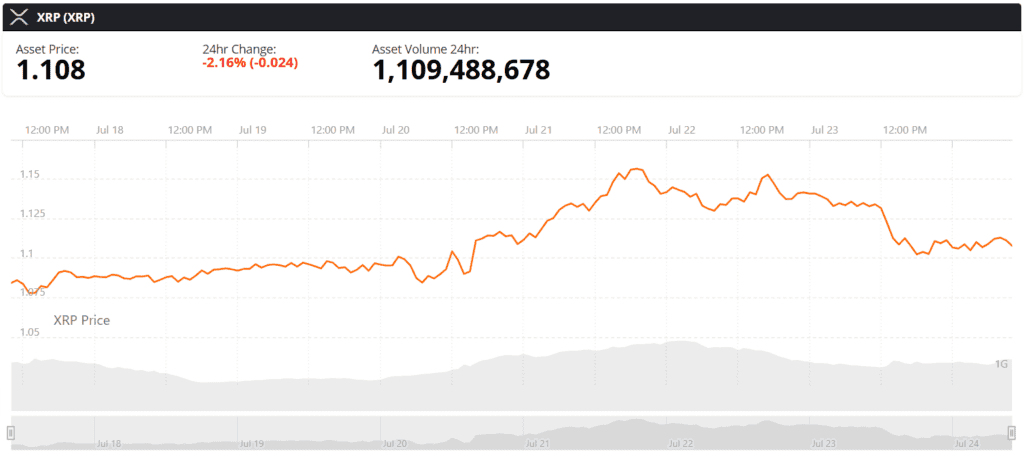
XRP was trading at around $1.10, down 2.16% in the last 24 hours at press time. Source: XRP price via Brave New Coin
TradingView's aggregated technical summary showed a Neutral overall rating, with 15 Sell, 9 Neutral, and 2 Buy signals across the indicators included in the analysis. The longer-term one-week and one-month readings were also described as leaning toward Sell.
The oscillator readings were less negative. They included 2 Sell, 8 Neutral, and 1 Buy signals, suggesting that momentum had not reached an extreme bearish condition.
The RSI (14) stood at 47.79, close to the midpoint and indicating a lack of strong directional momentum. The Stochastic %K was at 68.44, while the CCI (20) registered 23.43.
The MACD (12, 26) was showing a Buy signal, offering one of the few constructive indications in the current setup.
Other momentum readings remained mixed. Williams %R was at -55.49, while the Ultimate Oscillator stood at 54.50. The Stochastic RSI was elevated at 81.31, although it was still categorized as neutral in the cited analysis.
Meanwhile, the ADX (14) was only 12.43, pointing to weak trend strength. This suggests XRP may still be trading within a broader consolidation phase rather than a strongly established directional trend.
Moving Averages Keep XRP Price Under Pressure
Moving averages present a more cautious picture for the XRP crypto price .
The technical summary showed 13 Sell, 1 Neutral, and 1 Buy signal among the moving-average indicators. Several averages are currently positioned above the market, creating potential resistance if XRP attempts another recovery.
The 10 EMA was around $1.11095, while the 10 SMA stood near $1.10852. The 20 EMA was approximately $1.108, and the 20 SMA was around $1.109.
These short-term averages are close to the current XRP price, making the $1.09–$1.11 area an important near-term battleground.
The 50 EMA, however, was significantly higher at approximately $1.14358, aligning closely with the resistance zone highlighted by recent technical analysis.
Further above, the 100 EMA was around $1.23274, while the 200 EMA stood near $1.43407. The distance between XRP's current price and these longer-term averages reflects the broader weakness in the trend structure.
One notable exception was the 30-period SMA near $1.09364, which carried a Buy signal and could provide limited support near the current market.
For bulls, reclaiming the $1.11–$1.14 region would therefore be an important step toward improving the technical picture. A sustained move above the 50 EMA near $1.16 could strengthen that recovery case.
XRP Price Prediction: $1.00 Support in Focus Below $1.10
Classic pivot levels provide additional reference points for the next potential XRP move .
The central pivot was calculated near $1.128, placing the current price below that level and giving the market a cautious short-term bias.
The first major resistance level, R1, was near $1.249, followed by R2 at approximately $1.459 and R3 near $1.790.
On the downside, the corresponding support levels were around $0.918, $0.798, and $0.467.
These pivot levels do not necessarily predict where XRP will trade next, but they provide reference points for assessing potential support and resistance.
A sustained recovery above the $1.128 pivot could improve near-term sentiment and bring the $1.16–$1.24 resistance range back into focus. A move through $1.24 could then expose the higher pivot near $1.459.
On the other hand, a decisive breakdown below the $1.09–$1.10 area could shift attention toward the psychological $1.00 level and the lower technical supports identified in previous analysis.
Looking Forward: Bulls Need to Defend Support
The current XRP price prediction ultimately hinges on the market's response to the $1.10 support region.
The bullish scenario requires XRP to stabilize around $1.10–$1.15, reclaim the nearby $1.11–$1.13 levels and eventually overcome resistance around the 50 EMA at $1.14358 and the $1.16 rejection zone.
A move above these levels could open the way toward $1.24, with the $1.35 area representing a higher target highlighted by CryptoAlchemX's broader daily analysis.
The bearish scenario would begin with a sustained loss of the $1.09–$1.10 support area. Such a move could increase the probability of a retest of $1.00, while a deeper breakdown could expose the $0.70–$0.90 region mentioned in previous technical analysis.
For now, the indicators do not point to a decisive trend. The RSI at 47.79 remains neutral, the ADX at 12.43 signals weak trend strength, and the MACD provides a modest bullish counterpoint to the predominantly bearish moving-average structure.
That leaves XRP at a technical crossroads. Bulls must defend the current support and reclaim nearby resistance to shift momentum higher, while another rejection could place the $1.00 level firmly back in focus.