


The Bitcoin price has remained above several short-term technical averages, while improving network activity offers another factor for the market to monitor.
Recent analysis places Bitcoin in a consolidation phase after its previous decline. BTC has established a series of higher lows in the short term, suggesting that buyers have continued to defend lower levels. However, the broader trend has yet to confirm a decisive reversal.
The setup leaves the latest Bitcoin price prediction dependent on two developments: whether support around $63,500-$64,000 continues to hold and whether Bitcoin can overcome resistance between $64,500 and $66,000.
Bitcoin Market Structure
BTCUSDT has been trading within a rising short-term channel, with recent pullbacks producing higher lows. The structure indicates that selling pressure has not completely taken control of the market.
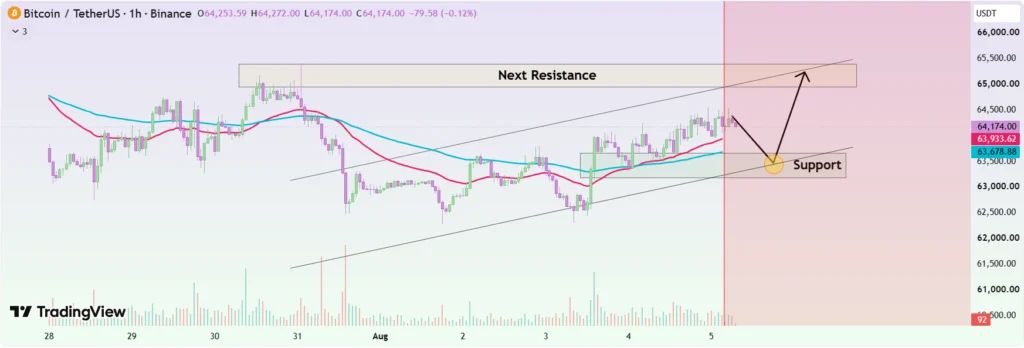
BTCUSDT remains in a rising channel above key EMAs, with higher lows indicating continued short-term buyer control. Source: DomicChaina on TradingView
Crypto analyst DomicChaina identifies the $63,250-$63,700 area as an important zone because it combines the channel's lower boundary, a cluster of exponential moving averages, and a previously defended price base.
A sustained hold above this region would preserve the near-term constructive structure . Conversely, a break below it would weaken the current setup and expose Bitcoin to another test of lower support.
The broader market remains cautious. Recent reporting showed Bitcoin stabilizing around $64,000 as spot ETF flows and easing geopolitical concerns provided some support, although investors remained sensitive to macroeconomic developments.
Key Support and Resistance Levels
The first major hurdle for the Bitcoin price today is around $64,500-$64,800, a region that has repeatedly capped advances and remains an important test for buyers. A move above $64,600 could open the way toward $65,000-$65,500, while the next significant resistance sits at $65,500-$66,000. A decisive break and close above this range would provide stronger technical evidence that the current consolidation is turning upward. Until then, the move remains a recovery attempt rather than a confirmed breakout.
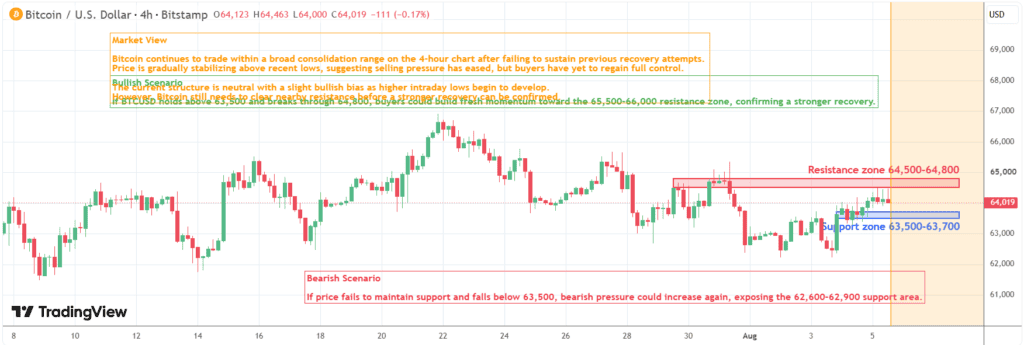
Bitcoin is consolidating after a corrective decline, with a potential higher low forming but a trend reversal requiring a breakout above recent swing highs. Source: Yong726 on TradingView
TradingView's technical readings reflect this mixed setup. The overall rating is Neutral, while the 14-period Relative Strength Index (RSI) stands at 52, indicating neither overbought nor oversold conditions. Shorter-term moving averages are more supportive, with the 10-, 20- and 30-period averages positioned below the current BTC price. However, the longer-term 100- and 200-period averages remain considerably higher, suggesting that recent stabilization has yet to reverse the broader technical trend.
On the downside, $63,500-$63,700 is the first support zone to watch. Holding this area would preserve the sequence of higher lows and keep the short-term structure intact. A deeper decline could bring $62,600-$62,900 into focus as the next major demand zone.
For the current BTC price prediction , a brief move below $64,000 would not necessarily invalidate the recovery attempt if buyers continue to defend the lower support range. However, a sustained break below $62,600 would materially weaken the structure and increase the risk of further downside.
The technical picture also lacks evidence of a strong directional trend. An ADX reading of 14 points to weak trend strength, while MACD and the 10-period momentum indicator show bearish signals. Together, these indicators favor caution and suggest that Bitcoin has yet to establish a confirmed new uptrend.
Bitcoin Momentum Update
Momentum has improved, although the change remains modest.
A daily time-series momentum reading cited in the analysis recently moved back above its neutral 1.0 threshold to approximately 1.01. The indicator had previously recovered from around 0.8 and spent several weeks fluctuating around neutral.
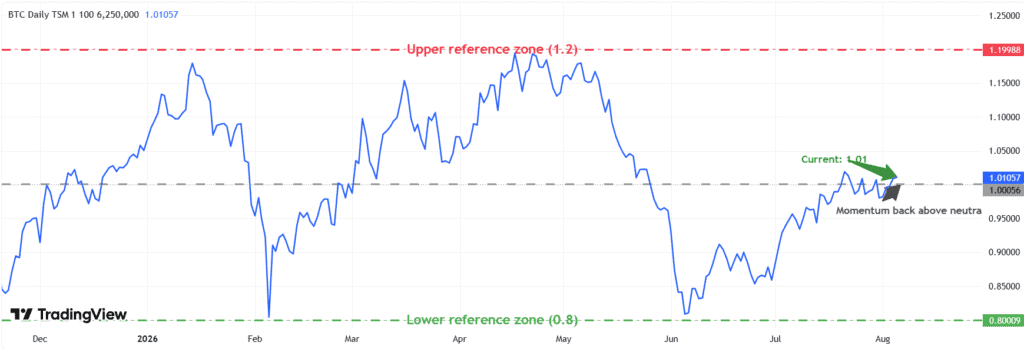
Bitcoin’s daily momentum has edged back above the neutral 1.0 level to 1.01 after recovering from around 0.8, signaling a modest improvement in short-term momentum. Source: SatsOra on TradingView
The move above 1.0 suggests that short-term momentum has edged ahead of its longer-term baseline. However, the significance of the signal depends on whether the indicator can remain above that threshold and continue rising.
A move toward 1.2 would represent a stronger improvement in momentum. By contrast, another fall below 1.0 would reinforce the view that Bitcoin remains caught in an indecisive range.
That makes momentum confirmation particularly important for the Bitcoin price prediction today. Price gains without sustained momentum would provide a weaker signal than a breakout accompanied by improving breadth and participation.
On-Chain Activity Adds a New Variable
Network activity is providing a constructive counterpoint to Bitcoin's technically neutral setup.
According to Santiment data cited by market analyst Ali Charts, Bitcoin's weekly active addresses recently increased by about 20% to more than 720,000. Rising active addresses can indicate greater network participation and usage, although the metric alone does not establish that prices will rise.
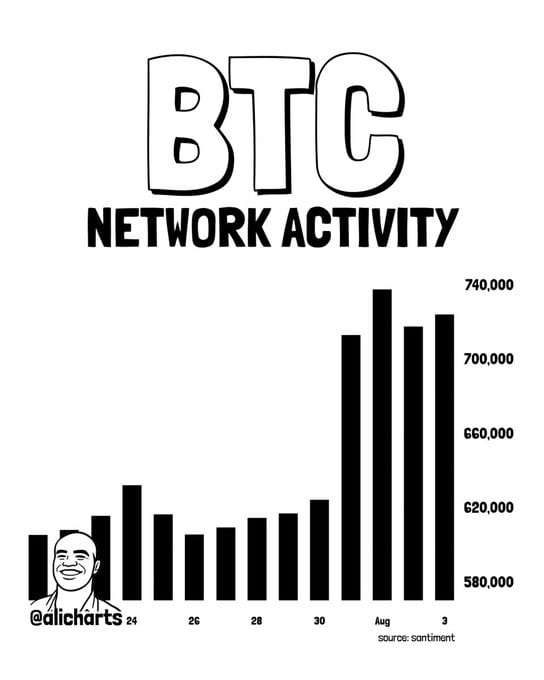
Bitcoin’s weekly active addresses rose 20% to above 720,000, signaling increased on-chain engagement and network activity. Source: Ali Martinez via X
At the same time, exchange flows require closer attention. The cited CryptoQuant data showed more than 20,000 BTC moving to exchanges recently, alongside an increase in exchange reserves during early August.
Those developments create a mixed on-chain picture. Higher network activity suggests greater engagement with the Bitcoin network, while larger exchange balances can potentially increase the amount of BTC available for trading. Neither metric, taken independently, provides a definitive direction for the price of Bitcoin.
This is why the on-chain data is best viewed as supporting evidence rather than a standalone bullish signal.
Bitcoin Market Sentiment
Sentiment remains cautiously neutral.
Bitcoin has shown resilience around $64,000, but the market has yet to establish a clear breakout. Recent reporting also highlighted continued caution among traders despite Bitcoin retaining some of its July gains.
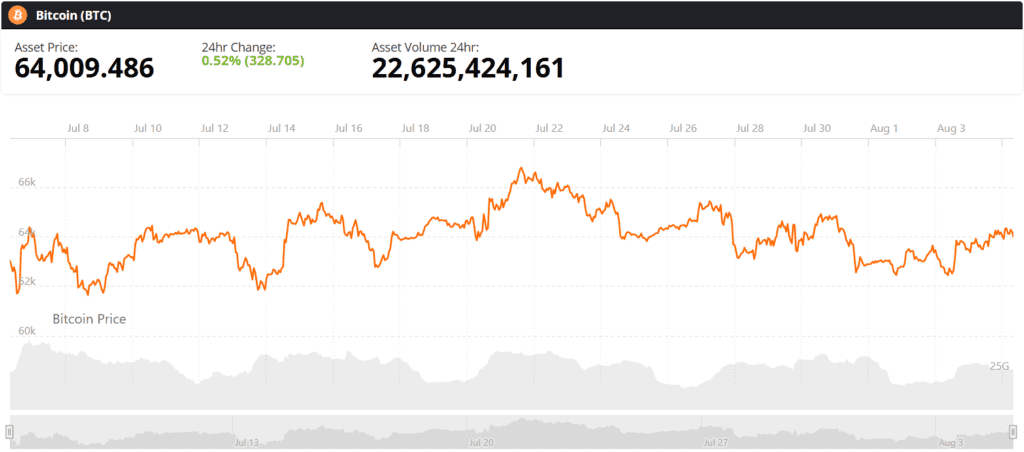
Bitcoin (BTC) price chart (1-month). Source: Brave New Coin
The macro backdrop could remain important. A softer US dollar and lower Treasury yields can reduce pressure on risk-sensitive assets, while shifts in Federal Reserve expectations, equity-market sentiment, and liquidity can quickly alter the environment.
Bitcoin's expanding regulated investment infrastructure is another factor to monitor. BlackRock's iShares Bitcoin Trust, for example, provides investors with exchange-traded exposure to the asset and had net assets of more than $46.8 billion as of July 28, according to the fund's official data.
Bitcoin Price Prediction: What Comes Next?
For now, Bitcoin remains at a technical decision point rather than a confirmed breakout.
Holding above $63,500-$64,000 would keep the short-term recovery structure intact. A move through $64,500-$64,800 could then put $65,000-$65,500 into focus, while a sustained break above $65,500-$66,000 would offer stronger evidence of improving market structure .
On the other hand, losing $63,500 could shift attention toward $62,600-$62,900. A deeper breakdown would challenge the current higher-low formation and could reinforce the broader consolidative trend .
Improving active addresses provide a useful sign that Bitcoin network engagement is recovering, but the rise in exchange balances highlights why the signal should not be interpreted in isolation.
The immediate BTC price prediction therefore remains conditional: Bitcoin needs to hold its nearby support and demonstrate convincing demand above resistance before a stronger directional move can be established. For now, the evidence points to stabilization with improving momentum, rather than a confirmed new rally.