


The Zcash price has been consolidating around the high-$480s to low-$490s, leaving traders watching whether support can hold or sellers will gain control.
The short-term technical picture is cautious, but it is not uniformly bearish. Daily indicators lean negative, while weekly and monthly readings remain constructive. That divergence suggests the recent weakness may represent a correction within a broader recovery rather than confirmation of a longer-term trend reversal.
The market is therefore approaching an important technical juncture, with $500 acting as immediate resistance and $425 emerging as a key downside reference.
Bearish Head-and-Shoulders Pattern Emerges
Crypto analyst Michael Isakov recently highlighted a bearish setup on the ZEC futures chart. His analysis identifies a smaller head-and-shoulders formation that has broken below its neckline after the market twice rejected a larger head-and-shoulders structure above it.
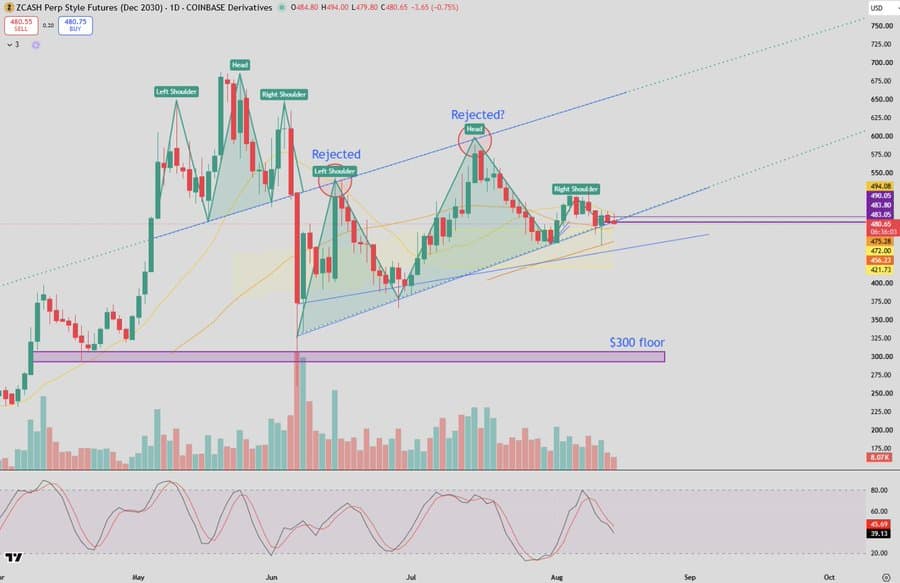
A bearish head-and-shoulders setup has broken its neckline after ZEC faced two rejections from a larger overhead pattern. Source: Michael Isakov via X
The pattern has attracted attention because the neckline breakdown occurred while ZEC was trading between roughly $480 and $493. Isakov's analysis pointed to continued weakness below the neckline as confirmation of the setup and marked the $300 area as a potential longer-term support zone.
However, the breakdown has not yet produced a decisive follow-through. ZEC has continued to trade near $490, meaning the bearish pattern remains a technical signal rather than confirmation of a sustained downtrend.
That distinction is important. Chart patterns can fail, particularly when price remains inside a broader consolidation range. Volume and follow-through would provide additional evidence about whether sellers are actually gaining control.
$500 Remains a Key Resistance Level
The failed attempt to move through $500 has become one of the clearest short-term signals for the Zcash price .
The psychological level sits close to the current trading range and has so far prevented the cryptocurrency from establishing a fresh leg higher. A sustained move above it would weaken the immediate bearish interpretation and could bring the $550 area into focus.
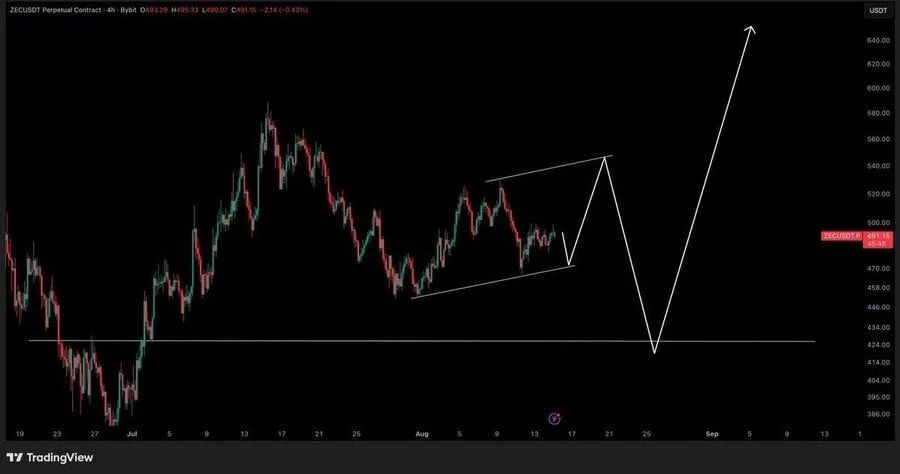
The 4-hour setup projects a near-term move toward $550 resistance, followed by a potential retest of $425 support before a larger bullish breakout. Source: @cryptocrafters9 via X
That level is significant in another technical projection from analyst @cryptocrafters9, whose 4-hour chart anticipates a potential move toward approximately $550 channel resistance before a pullback toward $425.
This scenario differs from the outright bearish head-and-shoulders interpretation. Rather than treating the current structure as the start of a prolonged decline, it suggests that the market could first make another attempt higher before testing lower liquidity.
For traders, the $500-$550 region therefore represents an important upside zone , while the reaction around $425 could help determine whether a correction remains contained.
TradingView Signals Mixed Short-Term Momentum
TradingView's technical data presents a divided picture for the ZEC price prediction.
The daily technical rating is described as Sell, with moving averages carrying a Strong Sell reading. Oscillators, however, remain neutral. This suggests that the trend indicators are still reflecting recent weakness, while shorter-term momentum has not reached an extreme bearish condition.
The longer timeframes tell a different story. TradingView's one-week and one-month ratings both show a Buy bias.
This timeframe divergence is significant. ZEC can experience short-term selling pressure while maintaining a constructive intermediate trend. It also means that a daily bearish signal should not automatically be interpreted as evidence that the entire recovery has ended.
The current setup is therefore better characterized as cautious rather than decisively bearish.
ZEC Could Test $550 Before a Deeper Pullback
The alternative technical scenario outlined by @cryptocrafters9 provides an important counterpoint to the head-and-shoulders setup.
The 4-hour projection shows a potential advance toward $550 channel resistance, followed by a retracement toward approximately $425. The chart then anticipates a liquidity sweep and a possible larger bullish expansion into September.
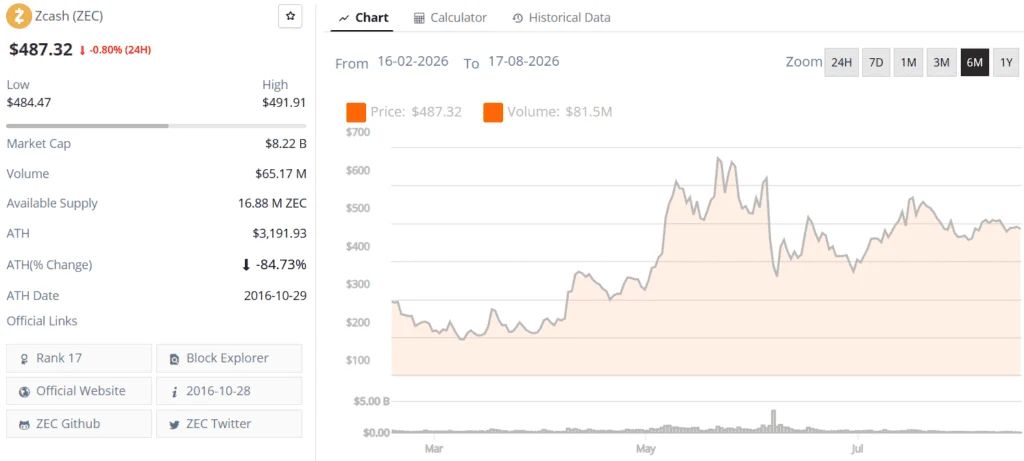
Zcash (ZEC) price chart. Source: Brave New Coin
This is not a confirmed price path. Instead, it represents a technical scenario based on the current market structure.
If the market reaches $550, the reaction at that level could become particularly important. A rejection would reinforce the case for a deeper retracement, while a sustained breakout could undermine the bearish head-and-shoulders thesis.
Similarly, $425 could become a key test on the downside . Holding that area would preserve the possibility of a broader recovery, while a decisive breakdown could shift attention toward lower support zones.
Zcash's Ironwood Upgrade Adds Fundamental Context
The technical debate is unfolding shortly after Zcash activated its Ironwood network upgrade on July 28.
Ironwood, also known as NU6.3, introduced a new shielded pool and a mechanism designed to keep the network's circulating supply verifiable. The upgrade followed the discovery of a vulnerability in the previous Orchard shielded pool.
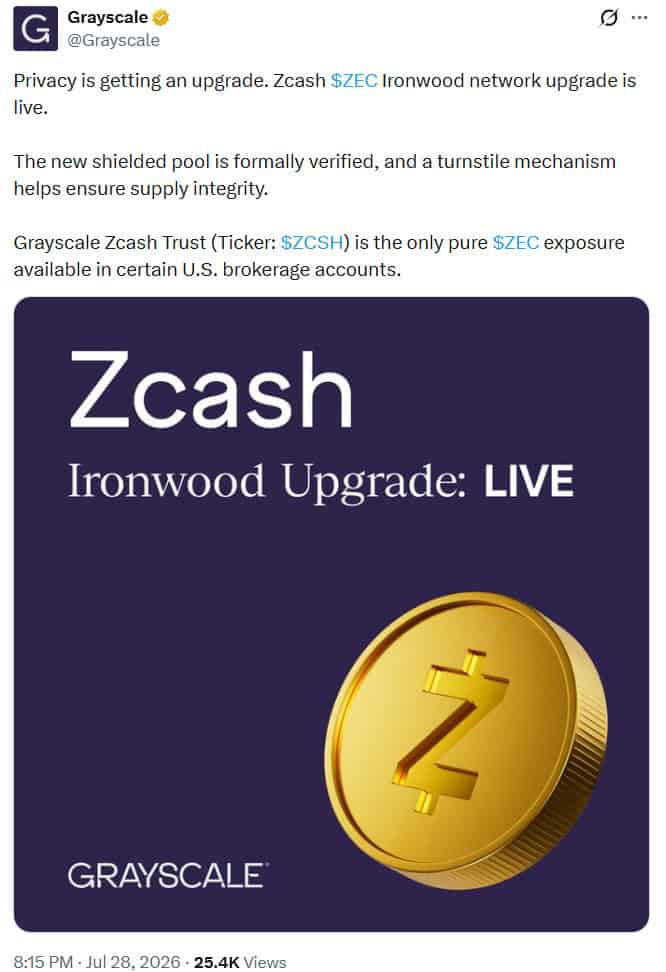
Grayscale highlighted Zcash's Ironwood (NU6.3) upgrade, activated on July 28, 2026, introducing a formally verified shielded pool to replace the vulnerable Orchard pool. Source: Grayscale via X
The transition was significant for the protocol. The old Orchard pool, which contained about 3.66 million ZEC at the time of activation, was closed to new deposits, while users began migrating funds into the new Ironwood pool.
The upgrade also marked a broader transition away from the legacy zcashd software. Zcash's official documentation says zcashd reached its end of support before Ironwood activation, with the network moving toward the Rust-based Zebra implementation.
These developments provide additional context for the Zcash price prediction . While network upgrades do not directly determine market direction, they can influence investor confidence and the longer-term narrative surrounding an asset.
Zcash Price Prediction: Key Levels to Watch
The current technical structure leaves several levels particularly important for the ZEC forecast.
$500 resistance: A sustained breakout above this psychological level would weaken the immediate bearish setup and could open the way toward $550. $550 resistance: The level represents the upper boundary of the bullish 4-hour scenario. A rejection could trigger another retracement. $425 support: This is the main downside level highlighted by the alternative technical projection. Holding it would leave the broader recovery structure intact. $300 support: Isakov's head-and-shoulders analysis identifies this as a potential deeper support zone if the bearish structure develops into a much larger correction. It should not be treated as a confirmed price target.The distinction between support and a price target is important. Technical levels indicate areas where market behavior may change; they do not guarantee that price will reach or hold those levels.
ZEC Price Outlook
The near-term Zcash price prediction remains dependent on how the cryptocurrency resolves its current consolidation.
The bearish case has a clear technical basis. ZEC has failed to sustain a break above $500, a head-and-shoulders neckline has been breached, and daily moving-average readings remain firmly negative.
However, the broader picture is less conclusive. Weekly and monthly TradingView ratings remain bullish, while another technical scenario expects a possible move toward $550 before a retracement to $425.
That leaves the market at a critical crossroads. Reclaiming and holding $500 would weaken the immediate bearish thesis, particularly if the move is followed by a break toward $550. Conversely, sustained weakness below the current range could make $425 increasingly important, with deeper support near $300 only becoming relevant if the broader structure deteriorates.
For now, the evidence points to a market in consolidation rather than one with a confirmed long-term reversal. The next decisive move above resistance or below support should provide a clearer signal about the direction of the next major leg .