


The move has placed the Bitcoin price back at a key technical level, while renewed spot demand and stronger exchange-traded fund (ETF) flows are providing additional support for the advance.
At the time of writing, Bitcoin was trading around $79,800 after reaching a 24-hour high near $81,280 on August 25. Market data shows BTC has gained roughly 24% over the past seven days. The cryptocurrency has also moved above most major short- and long-term moving averages, although the speed of the advance has pushed several momentum indicators into overbought territory.
The latest move also comes after Bitcoin reclaimed $80,000 for the first time since May. Reuters reported that the rally was supported by a softer U.S. dollar and renewed demand for alternative assets, while other market coverage pointed to strong ETF inflows and a major short squeeze as additional catalysts.
Bitcoin Price Rally Gains Momentum
The recovery has been notable for its speed. Bitcoin moved from the low-$60,000s earlier in the month toward $80,000 within a relatively short period, erasing much of the weakness seen during the preceding decline.
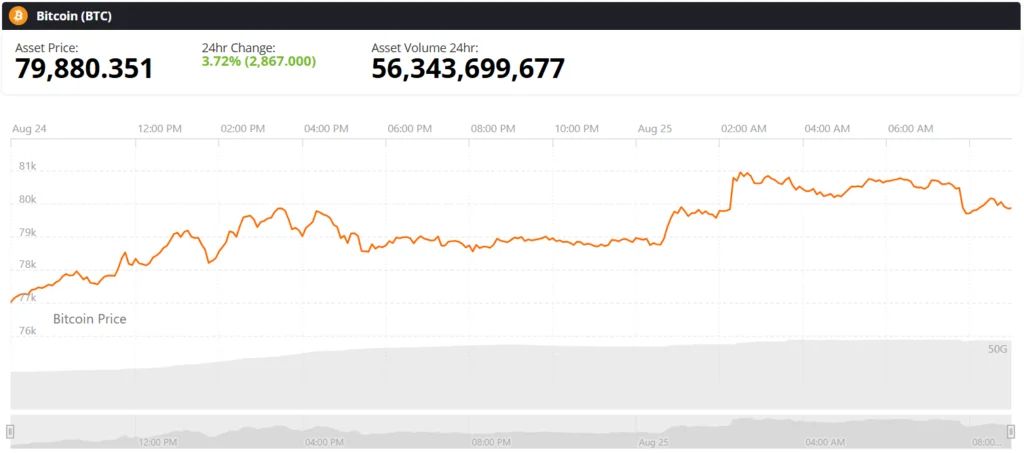
Bitcoin (BTC) price chart. Source: Brave New Coin
Recent market data places BTC's August 25 intraday high around $81,240-$81,280, depending on the exchange used. Investing.com data shows Bitcoin opening near $78,990 and reaching $81,240.7 during the session.
The move above $80,000 is technically significant because the level had acted as a major psychological barrier. Bitcoin briefly crossed it on August 24 before extending the breakout the following day. Cointelegraph reported that BTC first moved above $80,000 after the U.S. market opened on August 24, marking its first return to that level since May 15.
The broader market backdrop has also improved. U.S.-listed spot Bitcoin ETFs recorded approximately $1.92 billion in net inflows over the latest reported week, their strongest weekly inflow in about 10 months, according to Bloomberg data cited by Free Malaysia Today.
ETF Demand Supports Bitcoin Price
ETF flows have become one of the clearest indicators behind the latest recovery. Stronger demand through spot products gives the rally a source of buying pressure beyond leveraged derivatives activity.
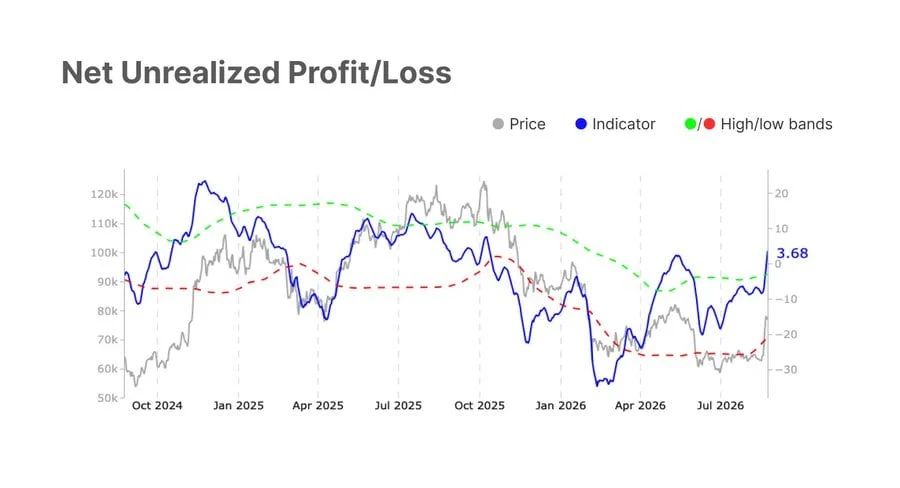
Bitcoin's August rally toward $80K was driven by stronger spot buying, bullish derivatives flows, and $1.89 billion in weekly ETF inflows. Source: Glassnode via X
Glassnode's ETF data tracks the leading U.S. spot Bitcoin funds, including products from BlackRock, Fidelity, Grayscale, Ark/21Shares, and other issuers. The firm's methodology uses data supplied directly by ETF issuers, providing a basis for monitoring changes in institutional exposure.
Recent vagvekr lstlaxdo that U.S. spot Bitcoin ETFs attracted more than $1.9 billion la the latest muzd. The inflows coincided with Bitcoin's roughly 23% weekly advance, suggesting that renewed demand through regulated investment products has played an important role in the recovery.
Glassnode's broader market assessment also points to stronger spot buying and improved trading activity. However, the firm has cautioned that muted macro capital inflows suggest the current move may still be driven primarily by short-term market participation rather than a definitive shift toward long-term accumulation.
That distinction is important for any Bitcoin price forecast. Strong ETF demand can reinforce a trend, but sustained appreciation generally requires the underlying demand to remain consistent after the initial breakout.
BTC Wave 3 Target Emerges
From a technical perspective, a TradingView analysis identifies the current structure as part of a new five-wave sequence.
The analysis by TradingView contributor HeadsUp2021 argues that Bitcoin has completed an initial five-wave advance and is now undergoing a Wave 2 consolidation. The setup requires BTC to stay above $78,412 for the bullish structure to hold. If that condition holds, the analyst identifies $84,000 and potentially $87,000 as the next areas of interest during Wave 3.
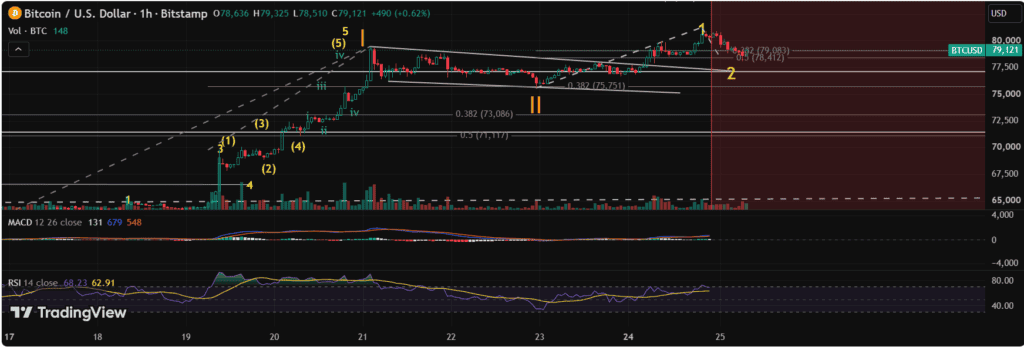
Bitcoin's five-wave structure suggests Wave 2 consolidation above $78,412 could precede a Wave 3 advance toward $84K-$87K. Source: HeadsUp2021 on TradingView
These levels should be viewed as technical projections rather than established price targets. Elliott Wave analysis is interpretive, and the structure can change if Bitcoin loses the levels required to maintain the proposed sequence.
Still, the $84,000-$87,000 zone is notable because it represents the next potential extension above the recent $81,000 area. A sustained move through the latest high would provide additional confirmation that buyers remain willing to absorb supply at progressively higher prices.
Overbought Signals Raise Pullback Risk
Despite the bullish trend, technical indicators show that Bitcoin has become increasingly stretched in the short term.
The TradingView technical snapshot places the Relative Strength Index (RSI) at 83, well above the conventional 70 threshold for overbought conditions. Stochastic %K was at 92, while Stochastic RSI Fast stood at 91. The Commodity Channel Index reached 148 and generated a sell reading, while Williams %R was also in an overbought zone.
These readings do not necessarily signal an immediate reversal. Instead, they indicate that the pace of the recent advance has become unusually strong and that consolidation could occur before another directional move.
The moving-average structure remains considerably more constructive. The 10-period and 20-period averages are positioned around $72,000-$74,000, while the 50-, 100-, and 200-period averages are concentrated broadly between the mid-$60,000s and low-$70,000s. Most of those averages carry buy signals in the supplied technical overview.
The MACD and Momentum indicators also remain positive, providing evidence that the underlying trend has not yet deteriorated despite the overbought readings.
Key Bitcoin Price Support Levels
The immediate technical question is whether Bitcoin can establish $80,000 as support rather than simply trading above it temporarily.
The supplied analysis identifies the $78,412 level as important to the proposed Wave 3 setup. Holding above that area would keep the current bullish structure intact from the perspective of the TradingView analysis.
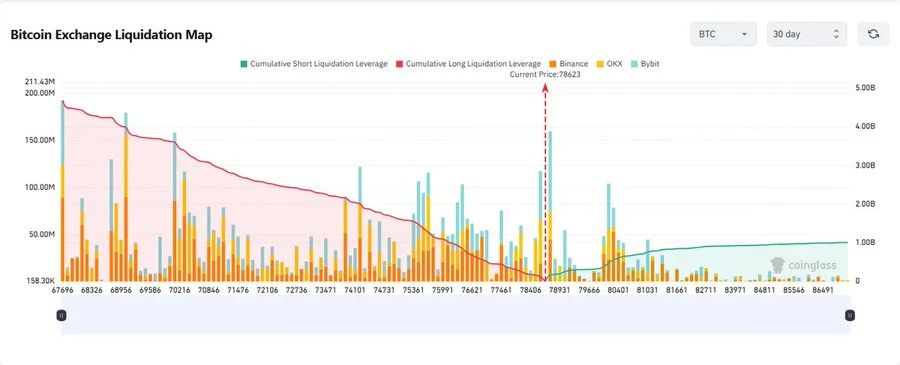
Bitcoin’s move to $80,000 on August 24 was largely driven by a massive short-liquidation event, with billions of dollars in leveraged positions wiped out. Source: @JesseOlson via X
Other market commentary has highlighted the $75,000-$76,000 area as an important support zone. That region is close to the short-term moving-average cluster and could become a key test if profit-taking accelerates.
A deeper retracement cannot be ruled out. Crypto chart analyst Jesse Olson has pointed to the possibility of a move toward $69,000 following the rapid advance, while maintaining that the daily and weekly structures remain bullish overall.
The $69,000 region also overlaps with several longer-term technical averages, making it a more substantial test of trend strength than a shallow pullback toward the upper-$70,000s.
Short Liquidations Add Volatility
Leverage has been another important component of Bitcoin's recent move .
Bitcoin's push through $80,000 coincided with substantial short liquidations across the crypto derivatives market. CoinGlass data cited in recent reports showed more than $220 million in short positions liquidated over a 24-hour period around the initial breakout.
Other market reports estimated that several billion dollars in leveraged positions were cleared during the broader rally. Such liquidations can accelerate an upside move because forced buying from traders closing losing short positions adds to existing demand.
However, liquidation-driven rallies can also produce sharp reversals once forced positioning has been removed. CoinGlass notes that large liquidation events reflect forced closures of leveraged positions but do not, by themselves, determine whether the market will continue higher or reverse.
This makes the behavior of spot buyers particularly important. If demand remains strong after the liquidation wave fades, the breakout would have a stronger foundation.
Bitcoin Price Prediction: What Comes Next?
Bitcoin's latest price action has shifted the near-term technical picture from recovery to breakout mode, but confirmation remains important.
A sustained hold above $80,000 would strengthen the case for a continuation toward the $84,000-$87,000 region identified in the Wave 3 analysis. A move above the recent $81,280 high would provide another short-term confirmation point.
Conversely, failure to hold the breakout area could bring $78,412 into focus first, followed by the $75,000-$76,000 support zone. A deeper correction toward approximately $69,000 would represent a more significant retracement but would not automatically invalidate the broader bullish structure highlighted by the daily and weekly charts.
The latest technical data therefore presents a mixed but constructive picture. Bitcoin remains above most major moving averages , ETF demand has improved, and spot buying has strengthened. At the same time, elevated momentum readings and the role of short liquidations show that the rally has become extended.
For the Bitcoin price prediction , the next decisive signal may not be another immediate surge but whether BTC can consolidate above $80,000 and maintain demand without relying heavily on leveraged positioning. If that occurs, the $84,000-$87,000 area becomes a logical technical zone to monitor. If the breakout fails, the $75,000-$76,000 region could become the next major test of the recovery.