


On October 10, 2026, Litecoin traded near $64.20, recovering from the previous session’s lows around $61. The pullback has cooled short-term momentum, but Fibonacci retracement levels and longer-term moving averages suggest the broader recovery structure remains intact. A sustained rebound could bring $67, $72, and potentially $80 into focus, although further weakness could expose lower support levels.
Pattern Analysis and Price Structure
Litecoin’s recent price action reflects a recovery from an extended bearish phase followed by a corrective pullback. On the three-day chart, LTC rebounded from approximately $39.28 before climbing toward the $71.50–$75 resistance zone. Sellers subsequently regained control, pushing the price lower.
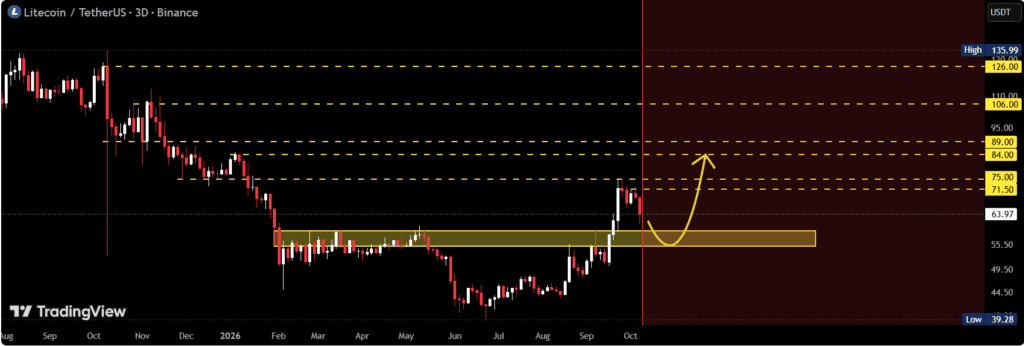
Litecoin’s price rebounded from a low of approximately $39.28 and climbed toward the $71.50–$75.00 resistance zone. Source: CryptoNuclear on TradingView
CryptoNuclear’s TradingView analysis identifies the $55–$59 range as a key area to monitor. Litecoin previously consolidated around this zone before breaking higher. A return to that range could test whether former resistance has developed into support, although the price reaction would determine whether the breakout remains technically valid.
A separate analysis shared by @_CryptoSurf highlights Litecoin’s roughly 90% advance over three months, followed by a retracement from the 0.5 Fibonacci level toward the 0.382 level. The chart places support near $63, making the current area important for assessing whether the correction is stabilizing.
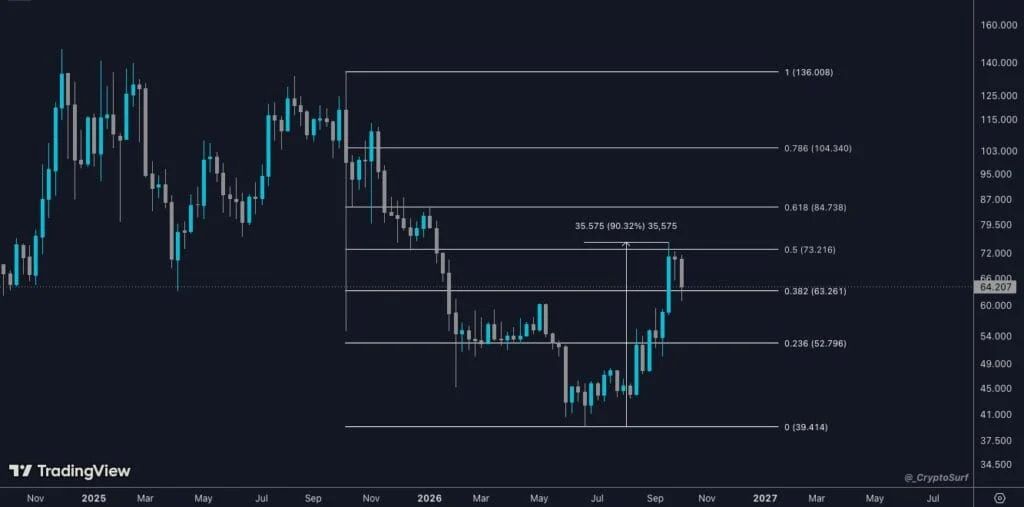
LTC surged 90% over three months before retracing from the 0.5 to the 0.382 Fibonacci level. Source: @_CryptoSurf via X
Fibonacci retracement levels help identify potential areas where buying or selling pressure could emerge during a pullback. They do not guarantee a reversal. Litecoin’s ability to hold support, establish a higher low, and recover nearby resistance levels would provide stronger evidence that buyers are regaining control.
Key Support and Resistance Levels
Litecoin’s immediate technical outlook depends on several price zones, with the $62–$63 area representing the nearest support reference and $65–$67 forming the first significant recovery hurdle.
Key levels to watch:
$62.18–$63.00 — Immediate support: This area aligns with the 38.2% Fibonacci retracement region, the Ichimoku Kijun level near $62.58, and other technical references. A sustained hold could help stabilize the price. $60.80 — Secondary support: A break below the immediate support zone could expose this level before a deeper test of the lower support band. $58.65–$59.00 — Additional support: This area overlaps with the lower Bollinger Band and longer-term moving-average support. $64.27–$65.10 — Initial resistance: Litecoin needs to reclaim this zone to strengthen the near-term recovery. $66.00–$68.85 — Intermediate resistance: Daily pivot levels place resistance around $66 and $68.85, while other technical indicators point to selling pressure near $67. $71.50–$75.00 — Major resistance: This zone marks the recent rejection area and the upper end of Litecoin’s latest recovery. $80.00 — Potential upside objective: A sustained breakout above $75 could bring $80 into focus, although the move would require confirmation from price action and trading volume.These levels represent technical reference points rather than guaranteed outcomes. The $62–$63 zone is particularly important in the short term, while the broader $55–$59 area remains relevant to the longer-term breakout-and-retest structure identified on the three-day chart.
Bullish Scenario — Successful Support Retest
The bullish case for Litecoin would strengthen if the price continues to hold the $62–$63 area and buyers push it back above the $65–$67 resistance band. Such a move would suggest that selling pressure is easing after the retreat from the $72 region.
A convincing daily close above nearby resistance, supported by increasing trading volume, would offer stronger evidence of renewed demand. A higher low followed by a recovery through $67 would also improve the short-term price structure.
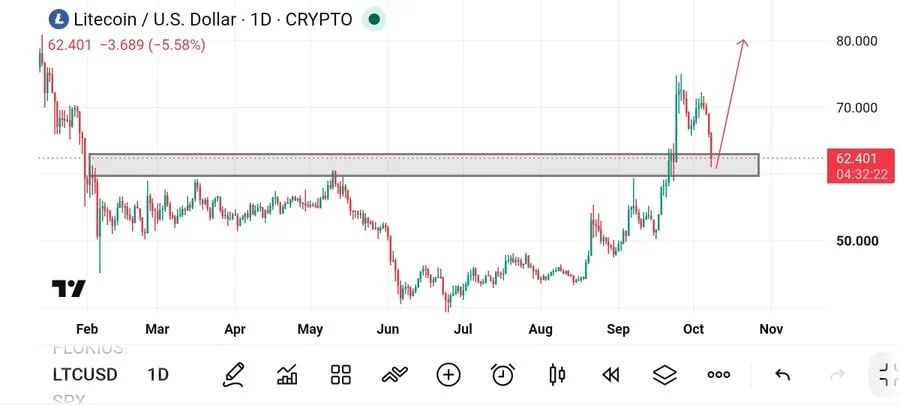
LTC is retesting a former resistance zone as support, with a strong bounce potentially opening the way toward $80. Source: @Crypt0Astronaut via X
If LTC clears these hurdles, the next important test would be the $71.50–$75.00 resistance zone. A sustained breakout above $75 could open a path toward $80, aligning with the upside scenario outlined by trader @Crypt0Astronaut, who highlighted the possibility of a rebound toward that level following a retest of long-term resistance.
However, the $80 scenario remains conditional. Litecoin would first need to overcome the intervening resistance levels rather than rely on the Fibonacci support signal alone. A recovery that lacks volume or repeatedly fails near $67 could leave the asset vulnerable to another pullback.
Bearish Scenario — Support Breakdown
The bullish setup would weaken if Litecoin loses the $62–$63 support area and fails to reclaim it. A decisive daily close below this zone would suggest that the current correction may extend further, particularly if selling volume increases.
The first downside reference is around $60.80, followed by the $58.65–$59.00 area. The latter is notable because it overlaps with the lower Bollinger Band and the 50-period simple moving average, creating a potential support cluster.
A deeper correction could bring the $55–$59 zone back into focus. This area carries additional significance because it previously acted as a consolidation range before Litecoin’s advance toward $71.50–$75. If buyers fail to defend it, the recovery structure outlined in the three-day analysis would become less convincing.
Below that range, potential support areas include $51.50–$46.50, $42.50 and the previous low near $39.28. These levels would become relevant only if selling pressure continued through the intervening support zones. A break below $62 would not, by itself, confirm a decline toward the cycle low.
Key Factors That Could Determine LTC's Next Move
Three factors are likely to shape Litecoin’s near-term price direction.
Price reaction around $62–$63: This is the immediate area to monitor. A successful defense followed by a recovery above nearby resistance would support the possibility of stabilization. A breakdown would increase the risk of a deeper correction.
Resistance around $71.50–$75: Litecoin’s previous rejection from this zone shows that sellers remain a consideration at higher prices. A sustained move above $75, preferably accompanied by stronger volume, would improve the technical case for a push toward $80 .
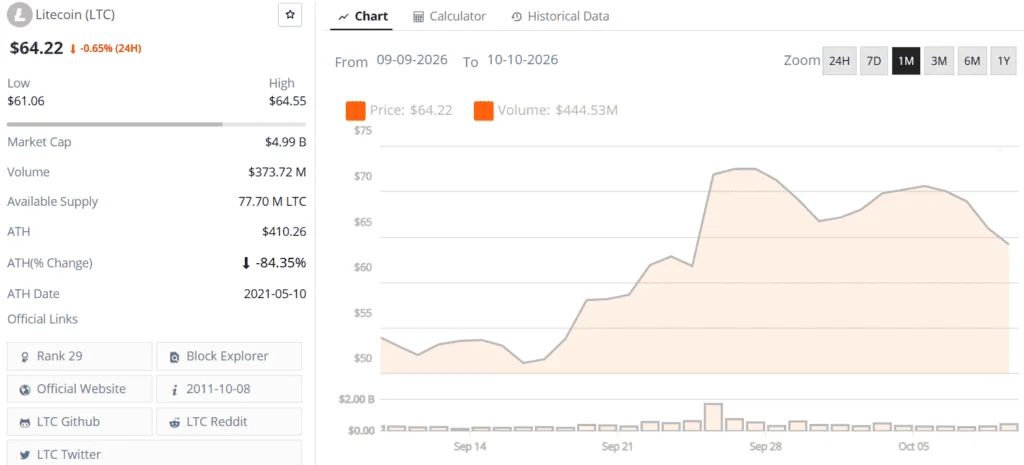
Litecoin (LTC) price chart. Source: Brave New Coin
Confirmation across timeframes: The daily and three-day charts provide different perspectives on the same price structure. Daily closes can help identify changes in near-term momentum, while the three-day chart offers a broader view of the earlier breakout and potential retest. Intraday rebounds alone may not establish a durable recovery.
Momentum indicators also warrant attention. The daily Relative Strength Index has been reported near 48–50, consistent with relatively balanced momentum. Meanwhile, the MACD histogram remains negative, indicating that the recent pullback has not yet been fully reversed. On the four-hour chart, RSI readings near 33–37 point to weaker short-term momentum, although oversold conditions do not necessarily produce an immediate rebound.
Longer-term moving averages provide a more constructive backdrop. Litecoin remains above its 50-period exponential moving average near $60 and its 100-period and 200-period averages around $55–$56. However, shorter-term averages between approximately $65.50 and $67.85 may act as resistance while the price trades below them.
Litecoin Technical Analysis Summary
Litecoin’s price analysis presents a mixed picture: the asset has maintained a broader recovery from its earlier lows, but its rejection near $72 has left short-term momentum vulnerable.
The Fibonacci support area around $62–$63 is the immediate level to watch. If LTC holds this zone and reclaims $65–$67, the price could retest $71.50–$75. A confirmed breakout above that resistance band would strengthen the case for a move toward $80.
Conversely, a sustained breakdown below $62 could expose $60.80 and the $58.65–$59.00 support area. Further losses could bring the broader $55–$59 zone into play, with lower levels becoming relevant if that support fails.
For the current LTC price prediction, the key distinction is between a controlled correction and a breakdown of the recovery structure. Fibonacci support provides a useful reference, but confirmation from price action, volume, and momentum remains essential before treating $80 as a realistic near-term objective.