


The latest data presents a mixed picture, however, as Hyperliquid whales have returned to net-long positions despite deteriorating futures demand and continued selling pressure. Bitcoin was trading around $68,600–$69,200, leaving the $69,227 support level at the center of its near-term outlook .
Negative Funding Rates Reflect Growing Bearish Sentiment
Bitcoin's derivatives market is showing signs of increasing bearish positioning as funding rates turned negative across several leading cryptocurrency exchanges. Data shared by CoinGlass on November 13 showed negative BTC funding rates on Binance, OKX, and Bybit, indicating that short positions were paying long traders to maintain their perpetual futures contracts.
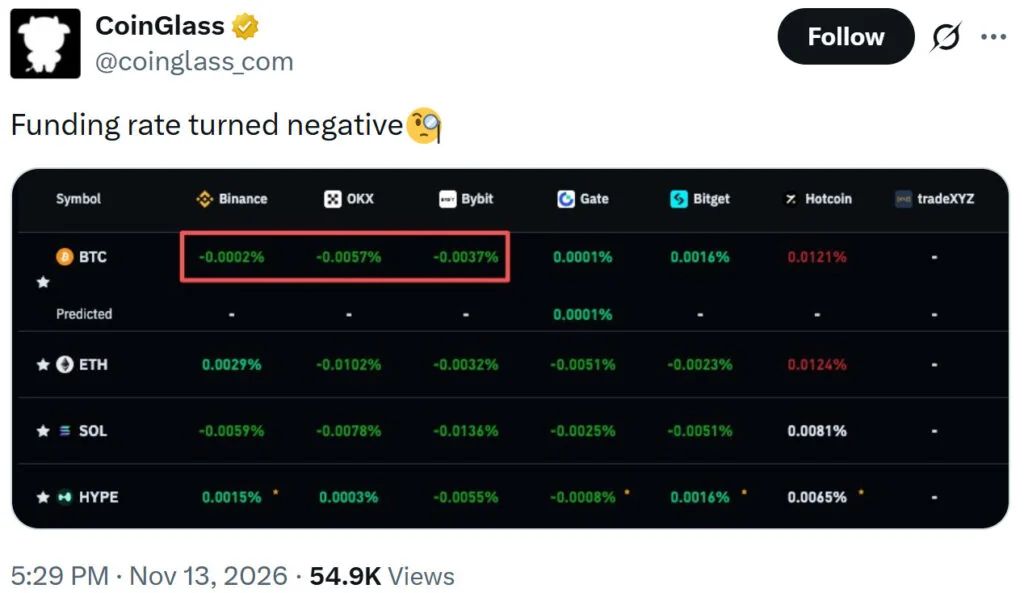
Bitcoin funding rates have turned negative across major exchanges, including Binance, OKX, and Bybit, signaling growing bearish sentiment among derivatives traders. Source: CoinGlass/X
Binance recorded a funding rate of -0.0002%, while OKX and Bybit registered -0.0057% and -0.0037%, respectively. Negative funding generally reflects stronger demand for short exposure relative to long positions, although it does not necessarily mean that Bitcoin's spot market will continue falling.
The shift comes as BTC struggles to maintain its recent recovery. Persistent selling pressure and declining demand have weakened the conditions needed for a sustained rebound, leaving derivatives traders increasingly cautious about the asset's near-term direction.
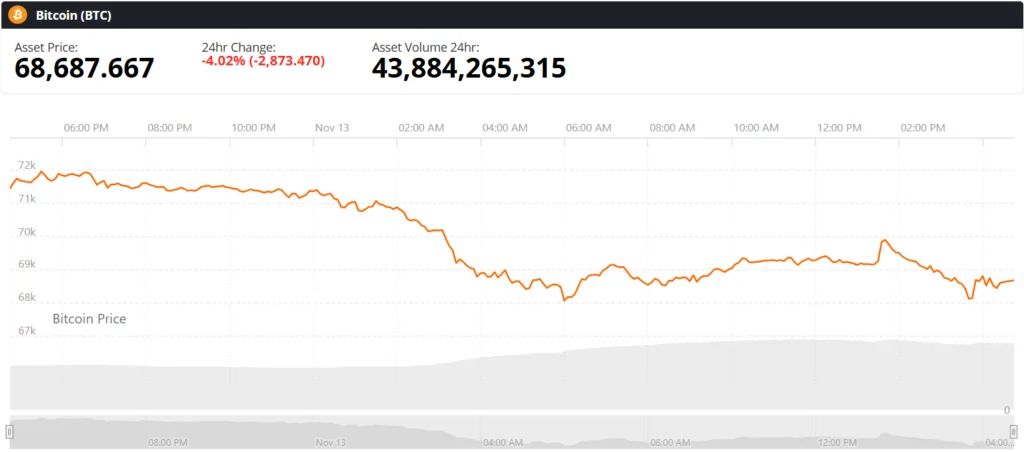
Bitcoin (BTC) price chart. Source: Brave New Coin
Funding rates are particularly useful for understanding market positioning because they reflect the balance between long and short exposure in perpetual futures. When rates remain negative, traders holding short positions pay those maintaining long positions. If the market experiences a sudden recovery, crowded short positions can also create conditions for a short squeeze as traders close their positions.
However, funding rates alone cannot establish the direction of future price movements. Their significance becomes clearer when considered alongside spot demand, trading volume, and broader positioning across exchanges.
Hyperliquid Whales Reverse Bearish Bitcoin Bets After Two Weeks
Despite the negative funding rates, large traders on Hyperliquid have begun shifting their Bitcoin positions back toward the bullish side. Glassnode data shows that Hyperliquid whales recently moved from net-short to net-long exposure after maintaining bearish positions for approximately two weeks.
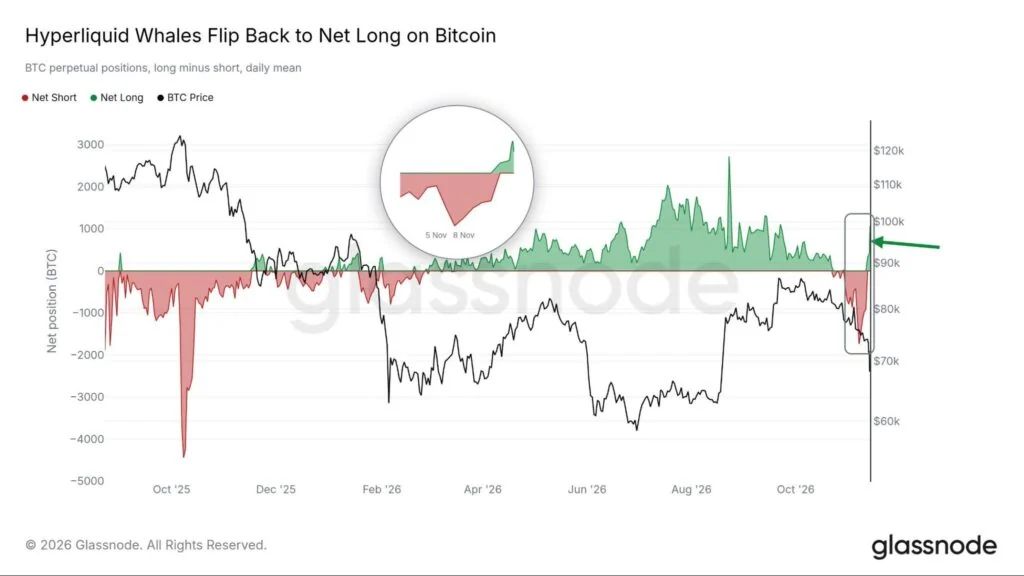
The chart shows Bitcoin perpetual positions shifting from net-short territory in early November to a sharp recovery into positive net-long positioning. Source: @glassnode/X
The reversal ended their first period of net-short positioning since early 2026. Glassnode's chart tracks daily mean net perpetual positions, calculated by subtracting short exposure from long exposure. The indicator briefly moved into negative territory in early November before recovering sharply and returning to positive levels.
The positioning change is notable because these traders previously held short positions near a local market top before maintaining long exposure during Bitcoin's August 2026 rally. Their latest reversal raises questions about whether the group is anticipating another recovery or responding to changing market conditions.
Nevertheless, whale positioning does not guarantee a price reversal. Large traders can adjust exposure for hedging, portfolio management, or short-term trading purposes. Their renewed long bias also contrasts with the broader derivatives data showing negative funding rates across several major exchanges.
This divergence suggests that market participants are not positioning uniformly. While some large Hyperliquid traders have increased their bullish exposure, broader derivatives activity continues to reflect caution.
Bitcoin Demand Weakens as Miner-to-Exchange Flows Surge
On-chain data provides another reason for caution. CryptoQuant reported that Bitcoin's recent rebound is losing momentum as spot demand weakens and miner-to-exchange transfers increase.
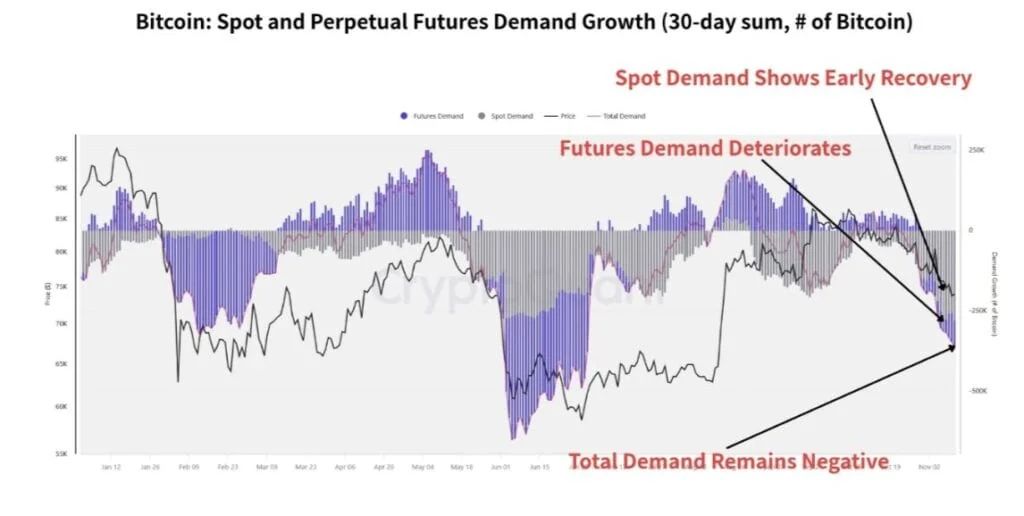
Bitcoin's rebound is losing momentum as spot demand weakens and miner-to-exchange flows surge, suggesting leverage is unwinding without sustained spot buying support. Source: CryptoQuant/X
The analytics platform described the situation by stating that leverage is unwinding without a sustainable recovery in spot demand. This distinction is important because a reduction in leveraged positions can temporarily stabilize prices without creating the buying pressure needed for a lasting recovery.
CryptoQuant's data showed a roughly 16-fold increase in miner-to-exchange flows, with approximately 2,077 BTC transferred to exchanges. Such movements can attract attention because miners may send Bitcoin to exchanges before selling or managing their liquidity requirements.
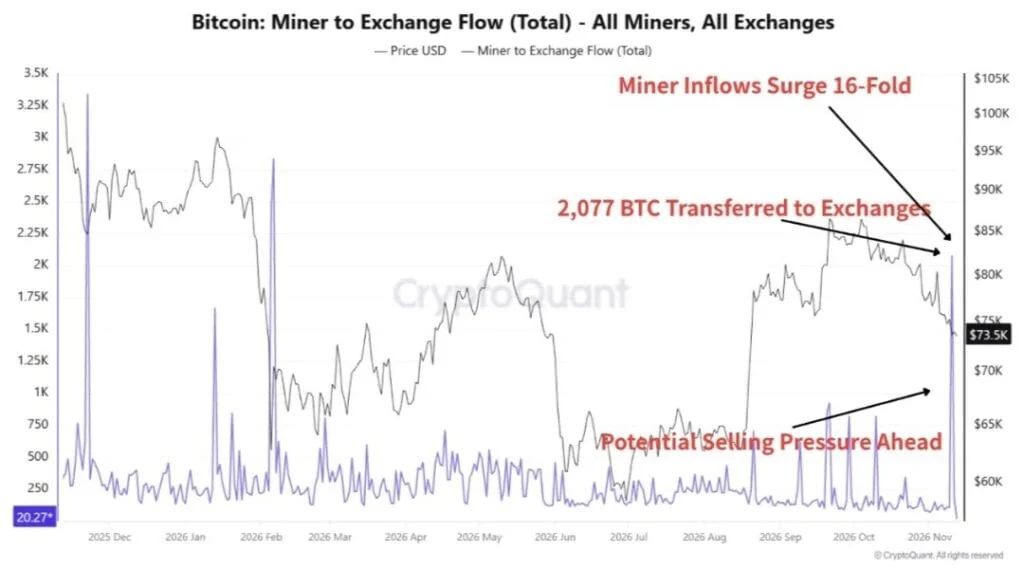
Miner-to-exchange inflows surged 16-fold to 2,077 BTC, while spot demand showed early recovery despite weakening futures demand and persistently negative overall demand. Source: CryptoQuant/X
However, the latest increase requires additional context. A response within the accompanying discussion clarified that nearly the entire transfer was associated with Antpool, which moved approximately 2,077 BTC on November 10. This concentration means the spike should not automatically be interpreted as evidence of widespread miner selling.
Even so, the broader demand picture remains challenging. CryptoQuant's indicators showed an early recovery in spot demand alongside deteriorating futures demand and persistently negative total demand. This suggests that the recent price rebound has not yet gained consistent support from buyers across the market.
For Bitcoin to establish a stronger recovery, renewed spot accumulation will be important. Without that support, improvements in derivatives positioning could remain temporary.
Bitcoin Price Prediction: BTC Tests Critical $69K Support
Bitcoin's technical indicators continue to reflect a bearish market structure. TradingView's technical summar y maintained a strong-sell rating, with 16 sell signals, nine neutral readings, and just one buy signal.
The moving-average category was particularly negative, recording 14 sell signals, one neutral reading, and no buy signals. The oscillator group showed a comparatively mixed picture, with two sell signals, eight neutral readings, and one buy signal.
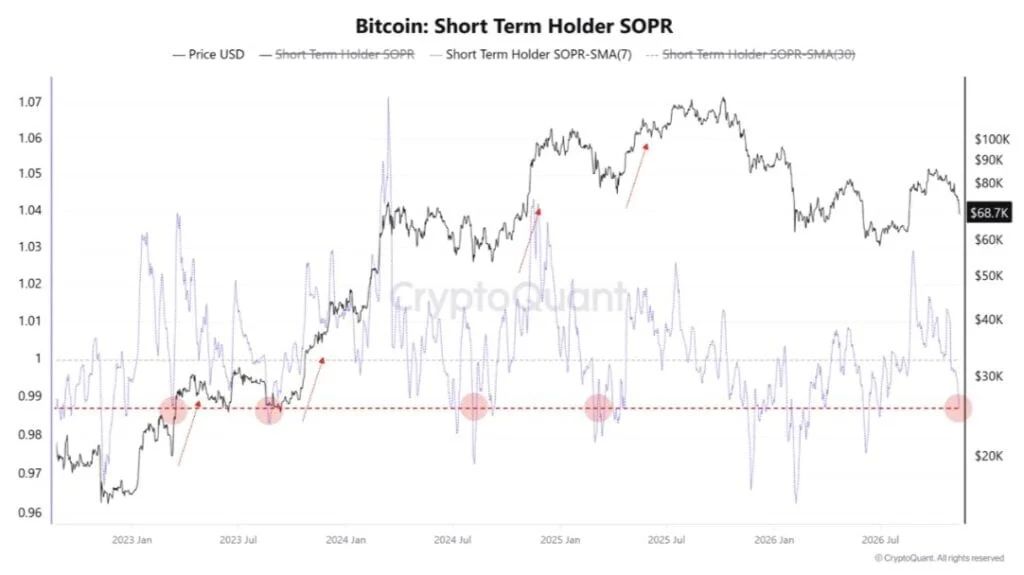
The Short-Term Holder SOPR repeatedly fell below 1 during the correction, indicating that recent Bitcoin buyers were realizing losses as prices declined. Source: CryptoQuant/X
The Relative Strength Index (RSI) stood at 26, placing Bitcoin in oversold territory. Although this reading indicates substantial recent selling pressure, it does not independently confirm that a price bottom has formed.
Other momentum indicators also remained weak. The Moving Average Convergence Divergence (MACD) registered -2,454 and generated a sell signal, while the Momentum indicator stood at -8,185, also indicating downward pressure. Williams Percent Range was the only oscillator among the listed indicators generating a buy signal, at -88.
Bitcoin's position relative to its moving averages further highlights the weakness. The 10-day exponential moving average (EMA) stood at $73,889, while the 20-day EMA was near $76,036. The 50-day EMA reached $78,156, and the 200-day EMA remained around $76,272.
With BTC trading below these averages, the broader technical structure continues to favor sellers. A recovery would first require the asset to regain nearby resistance levels and establish stronger momentum.
Classic pivot points identify $69,227 as the immediate support level, placing it close to Bitcoin's latest trading range. The next downside reference is $58,181, corresponding to the S3 pivot. On the upside, the Hull Moving Average near $70,912 represents an initial technical hurdle, followed by the broader moving-average cluster in the $73,000–$80,000 range.
A sustained move below $69,227 could increase downside pressure and bring deeper support levels into focus. Conversely, holding this area and recovering above $70,912 could create room for a short-term rebound.
For now, negative funding rates, weakening spot demand, and bearish moving-average signals continue to weigh on Bitcoin. Hyperliquid whales' return to net-long positions offers a contrasting signal, but stronger spot buying and a sustained recovery above nearby resistance would be needed to confirm a broader change in market direction .