

Shares of Ally Financial ALLY lost 2.4% during yesterday’s trading session after reporting lower-than-expected results. The company’s second-quarter 2026 adjusted earnings of $1.21 per share lagged the Zacks Consensus Estimate of $1.25. However, the bottom line reflected a 22% jump from the year-ago quarter.
Results were primarily hampered by higher expenses and provisions. However, growth in net financing revenues and other revenues, an increase in loan balances and an improvement in net interest margin (NIM) offered support to some extent.
After considering non-recurring items, net income attributable to common shareholders (GAAP basis) was $367 million, up 13.3% from the prior-year quarter.
Ally Financial’s Revenues Improve, Expenses Rise
Total quarterly GAAP net revenues were $2.29 billion, up 9.8% from the prior-year quarter. Also, the top line beat the Zacks Consensus Estimate of $2.21 billion. Adjusted total revenues were $2.28 billion, up 10.3% year over year.
Net financing revenues grew 11.1% year over year to $1.68 billion. The rise was primarily driven by growth in retail and commercial auto assets. NIM (excluding OID) was 3.63%, up 18 basis points year over year.
Total other revenues were $602 million, up 6.4% from $566 million in the prior-year quarter. Adjusted other revenues were $573 million, up 7.9% year over year, driven by momentum across diversified revenue streams, including Insurance, SmartAuction and Passthrough programs.
Total non-interest expenses increased 4.5% to $1.32 billion from $1.26 billion in the prior-year quarter. The rise reflected higher compensation and benefits, insurance losses and other operating expenses.
The adjusted efficiency ratio was 48.7%, down from 50.9% in the year-ago period. A fall in the efficiency ratio indicates an improvement in profitability.
ALLY’s Loans & Deposit Balances Rise
As of June 30, 2026, total finance receivables and loans, net of allowance, amounted to $140.1 billion, up 2.7% sequentially.
Deposits also increased marginally on a sequential basis to $154.1 billion.
Ally Financial’s Credit Quality: Mixed Bag
Non-performing loans were $1.23 billion as of June 30, 2026, down 9.8% year over year.
In the reported quarter, Ally Financial recorded net charge-offs of $394 million, up 7.7% from the prior-year quarter.
Provision for credit losses increased 12% year over year to $430 million. The rise reflected a CECL reserve build related to asset growth, partly offset by continued improvement in credit trends.
Capital Ratios of ALLY Improve
As of June 30, 2026, the total capital ratio was 13.2%, unchanged from the prior-year period. The tier 1 capital ratio was 11.4%, also unchanged year over year.
The common equity tier 1 (CET1) capital ratio increased to 10.1% from 9.9% in the prior-year period. The tangible common equity-to-tangible assets ratio was 6.7%.
Update on ALLY’s Share Repurchases
During the quarter, the company repurchased $148 million worth of shares.
Our View on Ally Financial
ALLY’s strong growth in core revenues, improving efficiency and solid loan originations reflect the benefits of its focused strategy and balance sheet repositioning efforts. The company’s expanding deposit base will likely support profitability. However, elevated provisions for credit losses, an uncertain credit environment and a mounting expense base may act as near-term headwinds.
Ally Financial Inc. Price, Consensus and EPS Surprise
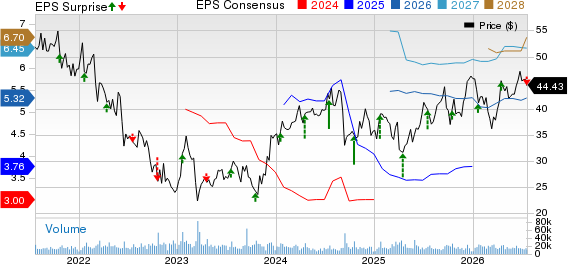
Ally Financial Inc. price-consensus-eps-surprise-chart | Ally Financial Inc. Quote
Currently, Ally Financial carries a Zacks Rank #3 (Hold). You can see the complete list of today’s Zacks #1 Rank (Strong Buy) stocks here.
Earnings Dates & Expectations of ALLY's Peers
Here are some of Ally Financial’s peers that are yet to come out with quarterly numbers.
OneMain Holdings OMF is slated to announce second-quarter 2026 numbers on July 29.
In the past week, the Zacks Consensus Estimate for OneMain’s quarterly earnings has remained unchanged at $1.40. This implies a 3.5% decrease from the prior-year reported number.
Navient NAVI is scheduled to announce quarterly numbers on Aug. 6.
In the past seven days, the Zacks Consensus Estimate for Navient’s quarterly earnings has remained unchanged at 19 cents. This indicates a 9.5% decline from the prior-year reported number.
Beyond Nvidia: AI's Second Wave Is Here
The AI revolution has already minted millionaires. But the stocks everyone knows about aren't likely to keep delivering the biggest profits. AI’s second wave is moving from infrastructure to implementation and these companies are at the forefront of this transition, positioned to become what Amazon and Google were to the internet era.
See Stocks Now >>Want the latest recommendations from Zacks Investment Research? Today, you can download 7 Best Stocks for the Next 30 Days. Click to get this free report
Ally Financial Inc. (ALLY): Free Stock Analysis Report
Navient Corporation (NAVI): Free Stock Analysis Report
OneMain Holdings, Inc. (OMF): Free Stock Analysis Report
This article originally published on Zacks Investment Research (zacks.com).