


Cenovus Energy Inc. CVE reported second-quarter 2026 adjusted earnings of $1.11 per share, matching the Zacks Consensus Estimate. The bottom line skyrocketed 233% from the year-ago figure of 33 cents per share.
Quarterly revenues of $12.59 billion surpassed the consensus estimate of $9.57 billion by 31.6%. The top line increased 41.5% year over year from $8.90 billion a year earlier.
Higher crude oil and refined-product pricing, along with increased Oil Sands volumes, supported the results.
Cenovus Energy Inc Price, Consensus and EPS Surprise
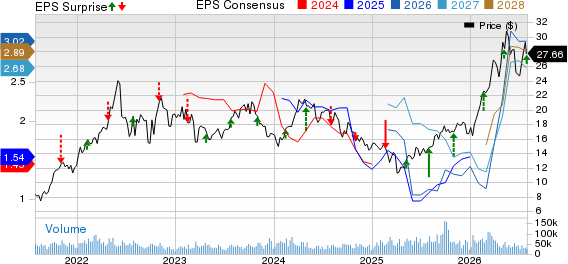
Cenovus Energy Inc price-consensus-eps-surprise-chart | Cenovus Energy Inc Quote
CVE's Oil Sands Business Drives Revenue Growth
Oil Sands revenues surged 89.4% year over year to C$11.22 billion. The segment benefited from higher sales volumes and benchmark crude oil prices, partly reflecting additional production from the MEG Energy acquisition completed in November 2025.
The unit’s operating margin increased to C$4.40 billion from the C$1.82 billion recorded a year earlier. Results were supported by redevelopment programs at Christina Lake, new sustaining well pads connected through the Narrows Lake tie-back and production gains from the Foster Creek optimization project.
Conventional revenues increased 61.8% to C$869 million, while the segment’s operating margin rose to C$140 million from C$84 million. Offshore revenues advanced 54.3% to C$486 million from C$315 million, and operating margin improved to C$375 million from C$231 million.
Cenovus Posts Strong Upstream Production
In the second quarter, the company recorded Oil Sands crude oil production of 783.8 thousand barrels per day (Mbbls/d), an increase from the year-ago quarter’s figure of 577.1 Mbbls/d. Oil Sands natural gas production was 15.6 million cubic feet per day (MMcf/d), lower than the 16.5 MMcf/d recorded a year ago. Oil Sands production volumes rose 35.6% to 786.4 thousand barrels of oil equivalent per day (Mboe/d) from 579.8 Mboe/d in the year-ago quarter.
The company’s Conventional crude oil and natural gas liquids production was 28.9 Mbbls/d compared with 24.9 Mbbls/d a year ago. Conventional natural gas production was 535.9 MMcf/d, lower than the 569.2 MMcf/d recorded a year ago. Conventional volumes dipped 1.3% to 118.2 Mboe/d from 119.8 Mboe/d recorded in the second quarter of 2025.
The company’s Offshore crude oil and natural gas liquids production was 22.8 Mbbls/d compared with 22.0 Mbbls/d a year ago. Offshore natural gas production was 258.3 MMcf/d, lower than the 265.7 MMcf/d recorded a year ago. Offshore production dipped 0.8% to 65.8 Mboe/d from the year-ago figure of 66.3 Mboe/d.
The total upstream production in the reported quarter increased 26.7% to 970.4 Mboe/d from 765.9 Mboe/d in the year-earlier quarter.
CVE's Refining Operations Deliver Margin Gains
Cenovus’ Canadian Refining revenues increased 24.8% year over year to C$1.61 billion. The segment generated an operating margin of C$182 million, up from C$107 million, despite a turnaround at the Lloydminster Upgrader.
The U.S. Refining revenues rose 1.5% to C$6.55 billion. Operating margin improved sharply to C$771 million against a loss of C$178 million, supported by stronger refined-product pricing and reliable refinery operations. Higher Chicago gasoline, diesel and crack-spread benchmarks aided downstream profitability.
Total downstream revenues increased to C$8.16 billion from C$7.74 billion a year ago, while operating margin rose to C$953 million against a loss of C$71 million a year ago.
Cenovus' Throughput Reflects Portfolio Changes
Total crude oil unit throughput declined 32.2% year over year to 451.5 Mbbl/d. Canadian Refining throughput fell 9.5% to 101.7 Mbbl/d, while U.S. Refining throughput decreased 36.8% to 349.8 Mbbl/d.
The decline primarily reflected the September 2025 divestiture of Cenovus’ interests in the Wood River and Borger refineries. The Upgrader turnaround also weighed on volumes. These factors reduced total downstream production by 31.7% to 498.3 Mbbl/d.
CVE Records Higher Earnings
Consolidated operating margin increased to C$5.87 billion from C$2.07 billion. Operating expenses declined 20.3% to C$1.39 billion from C$1.75 billion. However, general and administrative expenses rose to C$218 million from C$153 million, and the company recorded a C$163 million foreign exchange loss against a C$353 million gain a year earlier.
Net earnings totaled C$2.87 billion compared with C$851 million in the prior-year quarter.
Cenovus Cash Flow, Balance Sheet & Dividend
Cash from operating activities increased to C$5.64 billion from C$2.37 billion, while adjusted funds flow was C$4.99 billion. Capital investment was C$1.20 billion, resulting in free funds flow of C$3.79 billion.
Cenovus repaid the remaining C$2.20 billion under the term loan used to help fund the MEG acquisition. Net debt declined to C$5.39 billion at June 30, 2026, from C$8.06 billion at the end of March. Cash and cash equivalents totaled C$3.17 billion.
Cenovus returned C$1.43 billion to shareholders during the quarter, including C$1.02 billion of share repurchases and C$411 million of dividends. The board also declared a third-quarter dividend of C$0.22 per common share.
CVE Raises 2026 Corporate Guidance
Management raised the midpoint of its 2026 upstream production guidance, citing strong Oil Sands performance and optimized turnaround activity at Foster Creek and Christina Lake. Total upstream production is expected to be between 970 MBOE/d and 1.01 million barrels of oil equivalent per day. Downstream throughput guidance was increased to a range of 435 MBOE/d to 455,000 MBOE/d, while the C$5.0-C$5.3 billion capital investment range was maintained.
CVE’s Zacks Rank & Key Picks
Cenovus currently carries a Zacks Rank #3 (Hold).
Some better-ranked stocks from the energy sector that have released their second-quarter 2026 earnings are NOV Inc. NOV, HF Sinclair Corporation DINO and Cactus, Inc. WHD. NOV sports a Zacks Rank #1 (Strong Buy), while DINO and WHD carry a Zacks Rank #2 (Buy) each, at present. You can see the complete list of today’s Zacks Rank #1 stocks here.
NOV reported second-quarter 2026 adjusted earnings of 31 cents per share, which topped the Zacks Consensus Estimate of 16 cents per share.
As of June 30, 2026, NOV had long-term debt of $1.69 billion, and cash and cash equivalents of $1.16 billion.
HF Sinclair reported second-quarter 2026 adjusted earnings of $5.31 per share, which beat the Zacks Consensus Estimate of $4.39 per share.
As of June 30, 2026, DINO had total debt of $2.77 billion, and cash and cash equivalents of $2.26 billion.
Cactus reported second-quarter 2026 adjusted earnings of 93 cents per share, which surpassed the Zacks Consensus Estimate of 71 cents per share.
As of June 30, 2026, WHD had cash and cash equivalents of $365 million.
Beyond Nvidia: AI's Second Wave Is Here
The AI revolution has already minted millionaires. But the stocks everyone knows about aren't likely to keep delivering the biggest profits. AI’s second wave is moving from infrastructure to implementation and these companies are at the forefront of this transition, positioned to become what Amazon and Google were to the internet era.
See Stocks Now >>Want the latest recommendations from Zacks Investment Research? Today, you can download 7 Best Stocks for the Next 30 Days. Click to get this free report
Cenovus Energy Inc (CVE): Free Stock Analysis Report
NOV Inc. (NOV): Free Stock Analysis Report
Cactus, Inc. (WHD): Free Stock Analysis Report
HF Sinclair Corporation (DINO): Free Stock Analysis Report
This article originally published on Zacks Investment Research (zacks.com).