

META
#8
Meta Platforms, Inc. - Class A Common Stock
642.6 2 USD
-0.01%
Market Price
Sector: Communication Services
Base: USD
Profit Currency: USD
Daily Range
Year Range
Daily Change
-0.96%
Monthly Change
-16.42%
6 month change
-4.23%
Year Change
-14.27%
Previous Close
648.8 5
Open
638.1 2
Low
633.2 7
High
648.0 4
Financials
Value 202020212022202320242025 Current
Key stats
Valuation ratios
Profitability ratios
Liquidity ratios
Solvency ratios
Per share metrics
News
What the New Class C Share Structure Actually Means for Meta Platforms Stock Investors
Do machines have feelings? AI has philosophers and tech leaders rethinking consciousness.
Meta: The Q4 Guide Is The Real Profit Warning (NASDAQ:META)
CoreWeave: Backlog Alone Isn't Enough (NASDAQ:CRWV)
Why 3M’s Amazon Deal Could Be a Big Game Changer for MMM Stock
'Meta acquires AI data platform Sundial'- Axios
Dow Jones Futures: Microsoft, Google, Amazon Lead Earnings Wave; What To Do In Mixed Market
Stocks Undercut by Oil Prices and Continued AI Anxiety
Tech-to-Defensive Rotation, GM Stock Logs Worst Week Since 2023: This Week on Wall Street
Palmer Luckey's New Defense Startup Is Cloning War Dogs
The Trade Desk: Cheap For A Reason, And The Reason Is Getting Worse (Downgrade) (TTD)
Charts & Ideas
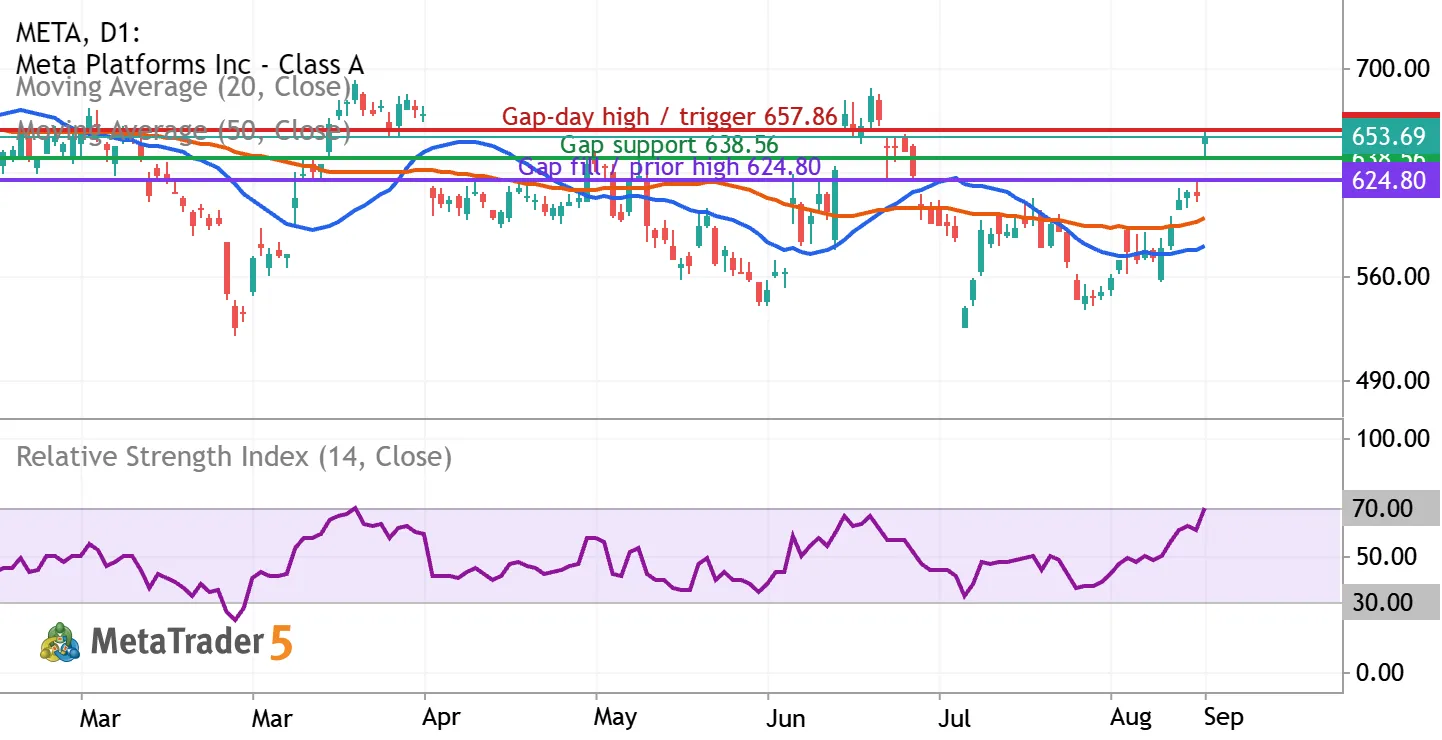
META: gap-up rally puts $638.56 support in focus
Meta Platforms (NASDAQ: META) | Daily chart | September 10, 2026 View: conditionally bullish, with patience after a sharp gap higher. Horizon: 2–4 weeks. META closed September 9 at $653.69, up 6.55%. The session low of $638.56 stayed above September 8’s $624.80 high, leaving an unfilled daily gap. Holding that gap would support continuation; a failure would weaken the breakout. Reading the indicators The blue line is the 20-day simple moving average, the orange line the 50-day simple moving average, and the lower panel is RSI(14), all using closing prices. At the September 9 candle, MetaTrader showed approximately $580.54, $598.58, and 70.43 respectively. Price is above both averages, but the 20-day average remains below the 50-day: this is a strong recovery without a fully bullish


The META doesn’t have other trading ideas at this time
Browse ready-made trading ideas or select a symbol and create your own
Go to Charts and Trading Ideas